Immigrants from Colombia vs Immigrants from Jamaica Poverty
COMPARE
Immigrants from Colombia
Immigrants from Jamaica
Poverty
Poverty Comparison
Immigrants from Colombia
Immigrants from Jamaica
12.3%
POVERTY
47.7/ 100
METRIC RATING
176th/ 347
METRIC RANK
14.4%
POVERTY
0.1/ 100
METRIC RATING
264th/ 347
METRIC RANK
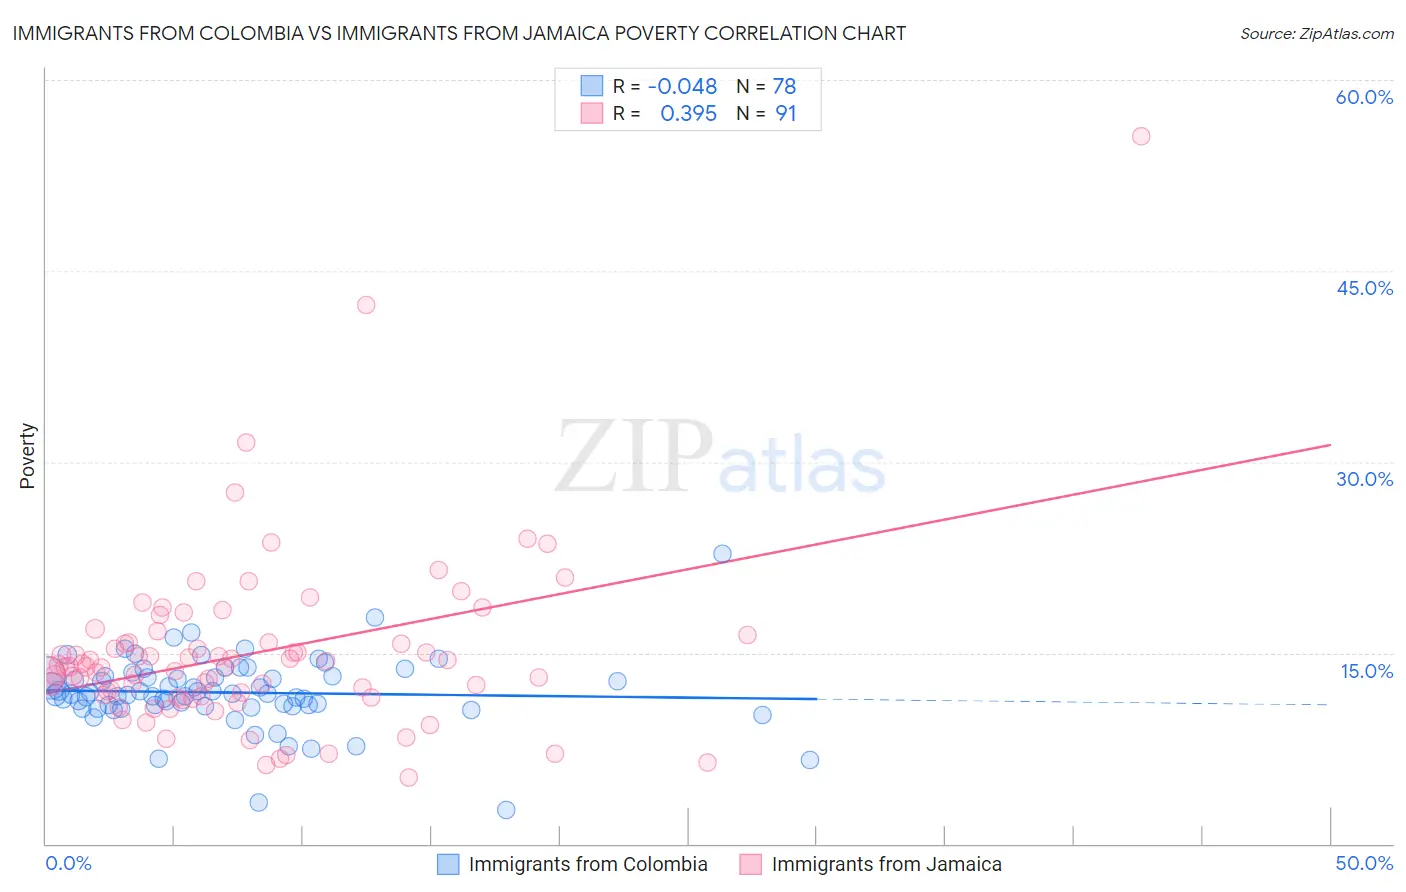
Immigrants from Colombia vs Immigrants from Jamaica Poverty Correlation Chart
The statistical analysis conducted on geographies consisting of 378,485,502 people shows no correlation between the proportion of Immigrants from Colombia and poverty level in the United States with a correlation coefficient (R) of -0.048 and weighted average of 12.3%. Similarly, the statistical analysis conducted on geographies consisting of 301,608,738 people shows a mild positive correlation between the proportion of Immigrants from Jamaica and poverty level in the United States with a correlation coefficient (R) of 0.395 and weighted average of 14.4%, a difference of 17.0%.
Poverty Correlation Summary
| Measurement | Immigrants from Colombia | Immigrants from Jamaica |
| Minimum | 2.6% | 5.2% |
| Maximum | 22.8% | 55.6% |
| Range | 20.2% | 50.4% |
| Mean | 11.9% | 14.9% |
| Median | 11.8% | 13.9% |
| Interquartile 25% (IQ1) | 10.8% | 11.6% |
| Interquartile 75% (IQ3) | 13.2% | 15.8% |
| Interquartile Range (IQR) | 2.3% | 4.3% |
| Standard Deviation (Sample) | 2.8% | 6.9% |
| Standard Deviation (Population) | 2.8% | 6.9% |
Similar Demographics by Poverty
Demographics Similar to Immigrants from Colombia by Poverty
In terms of poverty, the demographic groups most similar to Immigrants from Colombia are Immigrants from Syria (12.3%, a difference of 0.020%), South American (12.3%, a difference of 0.090%), Lebanese (12.3%, a difference of 0.23%), Celtic (12.3%, a difference of 0.24%), and Immigrants from Portugal (12.3%, a difference of 0.28%).
| Demographics | Rating | Rank | Poverty |
| Whites/Caucasians | 55.4 /100 | #169 | Average 12.3% |
| Immigrants | Oceania | 54.6 /100 | #170 | Average 12.3% |
| Immigrants | Spain | 51.3 /100 | #171 | Average 12.3% |
| Immigrants | Portugal | 50.5 /100 | #172 | Average 12.3% |
| Celtics | 50.1 /100 | #173 | Average 12.3% |
| Lebanese | 50.0 /100 | #174 | Average 12.3% |
| South Americans | 48.7 /100 | #175 | Average 12.3% |
| Immigrants | Colombia | 47.7 /100 | #176 | Average 12.3% |
| Immigrants | Syria | 47.5 /100 | #177 | Average 12.3% |
| Uruguayans | 44.7 /100 | #178 | Average 12.4% |
| Immigrants | Morocco | 44.0 /100 | #179 | Average 12.4% |
| Mongolians | 43.6 /100 | #180 | Average 12.4% |
| Immigrants | Afghanistan | 42.1 /100 | #181 | Average 12.4% |
| Immigrants | Cameroon | 41.7 /100 | #182 | Average 12.4% |
| Immigrants | Iraq | 40.2 /100 | #183 | Average 12.4% |
Demographics Similar to Immigrants from Jamaica by Poverty
In terms of poverty, the demographic groups most similar to Immigrants from Jamaica are Jamaican (14.4%, a difference of 0.090%), Immigrants from Guyana (14.5%, a difference of 0.13%), Guyanese (14.5%, a difference of 0.30%), Immigrants from Liberia (14.4%, a difference of 0.43%), and Cherokee (14.4%, a difference of 0.60%).
| Demographics | Rating | Rank | Poverty |
| Trinidadians and Tobagonians | 0.1 /100 | #257 | Tragic 14.3% |
| Ottawa | 0.1 /100 | #258 | Tragic 14.3% |
| Immigrants | Nicaragua | 0.1 /100 | #259 | Tragic 14.3% |
| Cape Verdeans | 0.1 /100 | #260 | Tragic 14.4% |
| Cherokee | 0.1 /100 | #261 | Tragic 14.4% |
| Immigrants | Liberia | 0.1 /100 | #262 | Tragic 14.4% |
| Jamaicans | 0.1 /100 | #263 | Tragic 14.4% |
| Immigrants | Jamaica | 0.1 /100 | #264 | Tragic 14.4% |
| Immigrants | Guyana | 0.1 /100 | #265 | Tragic 14.5% |
| Guyanese | 0.1 /100 | #266 | Tragic 14.5% |
| Iroquois | 0.1 /100 | #267 | Tragic 14.5% |
| Sub-Saharan Africans | 0.1 /100 | #268 | Tragic 14.5% |
| Immigrants | Cuba | 0.1 /100 | #269 | Tragic 14.6% |
| Central Americans | 0.1 /100 | #270 | Tragic 14.6% |
| Shoshone | 0.0 /100 | #271 | Tragic 14.7% |