Immigrants from Russia vs Arapaho Doctorate Degree
COMPARE
Immigrants from Russia
Arapaho
Doctorate Degree
Doctorate Degree Comparison
Immigrants from Russia
Arapaho
2.5%
DOCTORATE DEGREE
100.0/ 100
METRIC RATING
41st/ 347
METRIC RANK
1.2%
DOCTORATE DEGREE
0.0/ 100
METRIC RATING
342nd/ 347
METRIC RANK
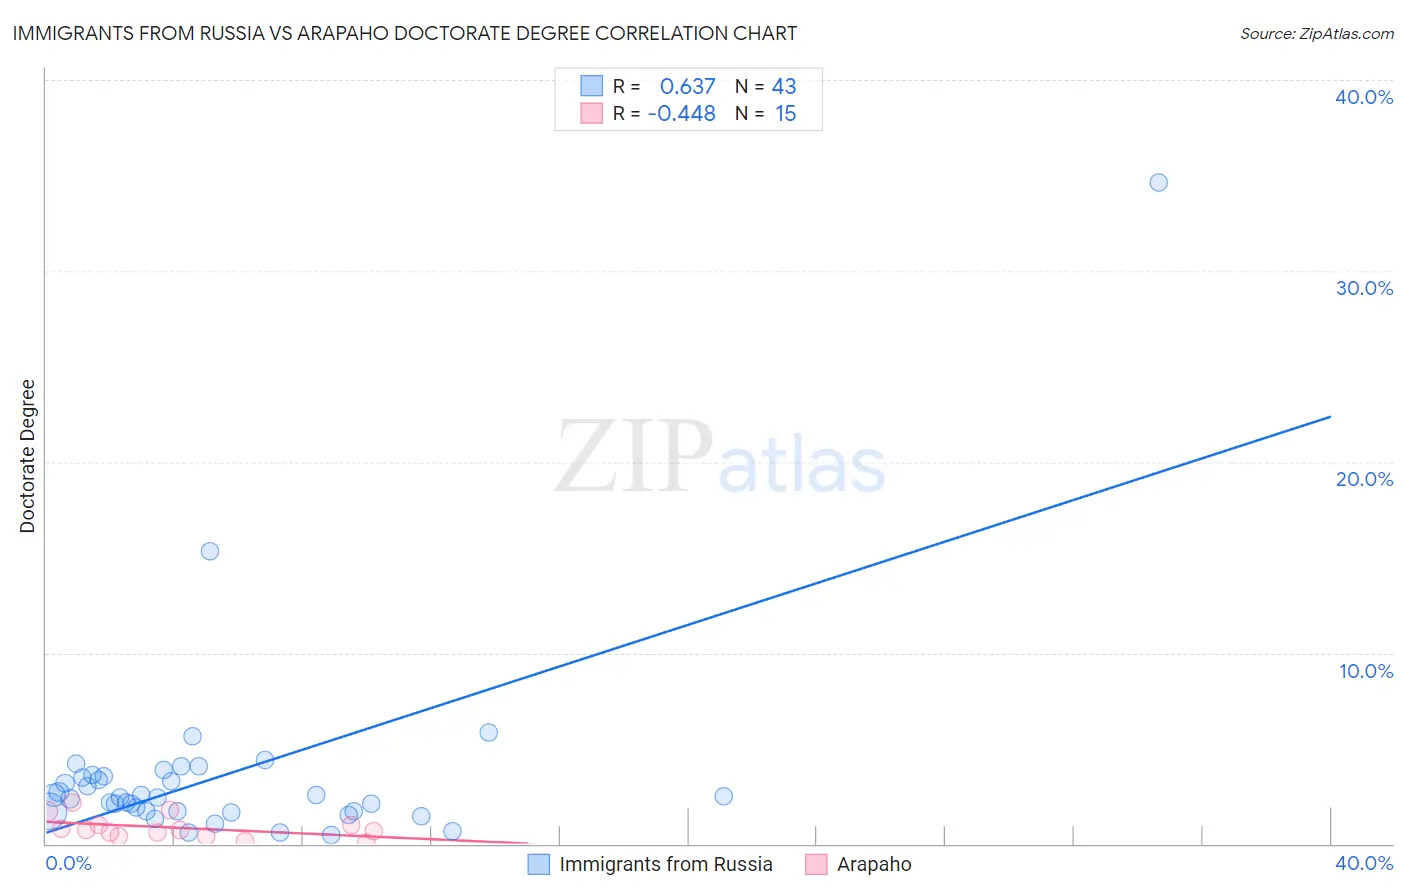
Immigrants from Russia vs Arapaho Doctorate Degree Correlation Chart
The statistical analysis conducted on geographies consisting of 346,147,144 people shows a significant positive correlation between the proportion of Immigrants from Russia and percentage of population with at least doctorate degree education in the United States with a correlation coefficient (R) of 0.637 and weighted average of 2.5%. Similarly, the statistical analysis conducted on geographies consisting of 29,522,759 people shows a moderate negative correlation between the proportion of Arapaho and percentage of population with at least doctorate degree education in the United States with a correlation coefficient (R) of -0.448 and weighted average of 1.2%, a difference of 116.0%.
Doctorate Degree Correlation Summary
| Measurement | Immigrants from Russia | Arapaho |
| Minimum | 0.49% | 0.090% |
| Maximum | 34.6% | 2.1% |
| Range | 34.1% | 2.0% |
| Mean | 3.6% | 0.84% |
| Median | 2.4% | 0.71% |
| Interquartile 25% (IQ1) | 1.7% | 0.41% |
| Interquartile 75% (IQ3) | 3.5% | 1.0% |
| Interquartile Range (IQR) | 1.8% | 0.59% |
| Standard Deviation (Sample) | 5.4% | 0.59% |
| Standard Deviation (Population) | 5.3% | 0.57% |
Similar Demographics by Doctorate Degree
Demographics Similar to Immigrants from Russia by Doctorate Degree
In terms of doctorate degree, the demographic groups most similar to Immigrants from Russia are Estonian (2.5%, a difference of 0.33%), New Zealander (2.5%, a difference of 0.63%), Immigrants from Ireland (2.5%, a difference of 0.74%), Russian (2.6%, a difference of 1.2%), and Immigrants from Kuwait (2.6%, a difference of 1.4%).
| Demographics | Rating | Rank | Doctorate Degree |
| Cypriots | 100.0 /100 | #34 | Exceptional 2.6% |
| Immigrants | Malaysia | 100.0 /100 | #35 | Exceptional 2.6% |
| Immigrants | Spain | 100.0 /100 | #36 | Exceptional 2.6% |
| Immigrants | Kuwait | 100.0 /100 | #37 | Exceptional 2.6% |
| Russians | 100.0 /100 | #38 | Exceptional 2.6% |
| Immigrants | Ireland | 100.0 /100 | #39 | Exceptional 2.5% |
| Estonians | 100.0 /100 | #40 | Exceptional 2.5% |
| Immigrants | Russia | 100.0 /100 | #41 | Exceptional 2.5% |
| New Zealanders | 100.0 /100 | #42 | Exceptional 2.5% |
| Soviet Union | 100.0 /100 | #43 | Exceptional 2.5% |
| Immigrants | Netherlands | 100.0 /100 | #44 | Exceptional 2.5% |
| Immigrants | South Africa | 100.0 /100 | #45 | Exceptional 2.4% |
| Immigrants | Austria | 100.0 /100 | #46 | Exceptional 2.4% |
| Immigrants | Western Europe | 100.0 /100 | #47 | Exceptional 2.4% |
| Asians | 100.0 /100 | #48 | Exceptional 2.4% |
Demographics Similar to Arapaho by Doctorate Degree
In terms of doctorate degree, the demographic groups most similar to Arapaho are Mexican (1.2%, a difference of 0.38%), Immigrants from Cuba (1.2%, a difference of 0.86%), Immigrants from Central America (1.2%, a difference of 1.7%), Puget Sound Salish (1.2%, a difference of 3.0%), and Fijian (1.1%, a difference of 3.4%).
| Demographics | Rating | Rank | Doctorate Degree |
| Immigrants | Caribbean | 0.0 /100 | #333 | Tragic 1.3% |
| Immigrants | Dominican Republic | 0.0 /100 | #334 | Tragic 1.3% |
| Immigrants | Haiti | 0.0 /100 | #335 | Tragic 1.3% |
| Nepalese | 0.0 /100 | #336 | Tragic 1.3% |
| Bangladeshis | 0.0 /100 | #337 | Tragic 1.2% |
| Puget Sound Salish | 0.0 /100 | #338 | Tragic 1.2% |
| Immigrants | Central America | 0.0 /100 | #339 | Tragic 1.2% |
| Immigrants | Cuba | 0.0 /100 | #340 | Tragic 1.2% |
| Mexicans | 0.0 /100 | #341 | Tragic 1.2% |
| Arapaho | 0.0 /100 | #342 | Tragic 1.2% |
| Fijians | 0.0 /100 | #343 | Tragic 1.1% |
| Immigrants | Mexico | 0.0 /100 | #344 | Tragic 1.1% |
| Lumbee | 0.0 /100 | #345 | Tragic 1.1% |
| Spanish American Indians | 0.0 /100 | #346 | Tragic 1.1% |
| Houma | 0.0 /100 | #347 | Tragic 0.96% |