Immigrants from Russia vs Immigrants from Croatia Married-Couple Family Poverty
COMPARE
Immigrants from Russia
Immigrants from Croatia
Married-Couple Family Poverty
Married-Couple Family Poverty Comparison
Immigrants from Russia
Immigrants from Croatia
5.0%
MARRIED-COUPLE FAMILY POVERTY
78.7/ 100
METRIC RATING
148th/ 347
METRIC RANK
4.6%
MARRIED-COUPLE FAMILY POVERTY
98.7/ 100
METRIC RATING
84th/ 347
METRIC RANK
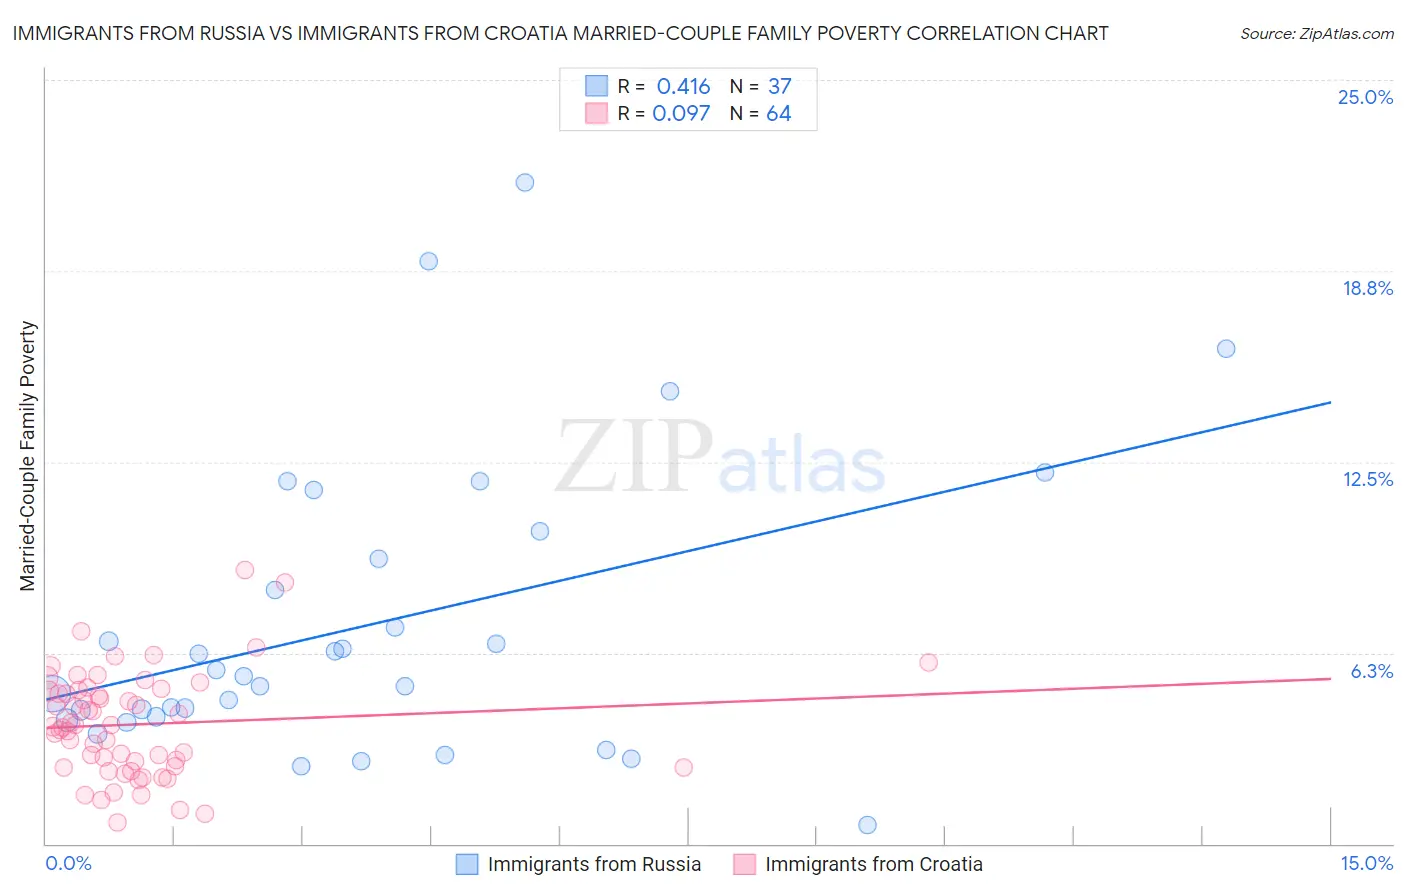
Immigrants from Russia vs Immigrants from Croatia Married-Couple Family Poverty Correlation Chart
The statistical analysis conducted on geographies consisting of 344,976,831 people shows a moderate positive correlation between the proportion of Immigrants from Russia and poverty level among married-couple families in the United States with a correlation coefficient (R) of 0.416 and weighted average of 5.0%. Similarly, the statistical analysis conducted on geographies consisting of 132,064,447 people shows a slight positive correlation between the proportion of Immigrants from Croatia and poverty level among married-couple families in the United States with a correlation coefficient (R) of 0.097 and weighted average of 4.6%, a difference of 10.2%.
Married-Couple Family Poverty Correlation Summary
| Measurement | Immigrants from Russia | Immigrants from Croatia |
| Minimum | 0.60% | 0.70% |
| Maximum | 21.6% | 8.9% |
| Range | 21.0% | 8.2% |
| Mean | 7.2% | 3.9% |
| Median | 5.5% | 3.9% |
| Interquartile 25% (IQ1) | 4.1% | 2.5% |
| Interquartile 75% (IQ3) | 9.8% | 5.0% |
| Interquartile Range (IQR) | 5.7% | 2.5% |
| Standard Deviation (Sample) | 4.8% | 1.7% |
| Standard Deviation (Population) | 4.7% | 1.7% |
Similar Demographics by Married-Couple Family Poverty
Demographics Similar to Immigrants from Russia by Married-Couple Family Poverty
In terms of married-couple family poverty, the demographic groups most similar to Immigrants from Russia are Syrian (5.0%, a difference of 0.0%), Immigrants from Oceania (5.0%, a difference of 0.030%), Brazilian (5.0%, a difference of 0.080%), Mongolian (5.0%, a difference of 0.20%), and Immigrants from Spain (5.0%, a difference of 0.21%).
| Demographics | Rating | Rank | Married-Couple Family Poverty |
| Immigrants | Brazil | 84.6 /100 | #141 | Excellent 5.0% |
| Immigrants | China | 84.6 /100 | #142 | Excellent 5.0% |
| Immigrants | Egypt | 83.4 /100 | #143 | Excellent 5.0% |
| Hmong | 83.2 /100 | #144 | Excellent 5.0% |
| Immigrants | Spain | 79.9 /100 | #145 | Good 5.0% |
| Mongolians | 79.8 /100 | #146 | Good 5.0% |
| Syrians | 78.7 /100 | #147 | Good 5.0% |
| Immigrants | Russia | 78.7 /100 | #148 | Good 5.0% |
| Immigrants | Oceania | 78.6 /100 | #149 | Good 5.0% |
| Brazilians | 78.3 /100 | #150 | Good 5.0% |
| Immigrants | Cameroon | 77.3 /100 | #151 | Good 5.0% |
| Albanians | 77.2 /100 | #152 | Good 5.0% |
| Immigrants | Kuwait | 76.3 /100 | #153 | Good 5.0% |
| Delaware | 73.7 /100 | #154 | Good 5.1% |
| Immigrants | Ethiopia | 72.4 /100 | #155 | Good 5.1% |
Demographics Similar to Immigrants from Croatia by Married-Couple Family Poverty
In terms of married-couple family poverty, the demographic groups most similar to Immigrants from Croatia are Immigrants from Denmark (4.6%, a difference of 0.13%), South African (4.6%, a difference of 0.23%), Immigrants from Turkey (4.6%, a difference of 0.27%), Canadian (4.5%, a difference of 0.29%), and Immigrants from North Macedonia (4.6%, a difference of 0.35%).
| Demographics | Rating | Rank | Married-Couple Family Poverty |
| Immigrants | Latvia | 99.1 /100 | #77 | Exceptional 4.5% |
| Scotch-Irish | 99.1 /100 | #78 | Exceptional 4.5% |
| Immigrants | Iran | 99.0 /100 | #79 | Exceptional 4.5% |
| Icelanders | 99.0 /100 | #80 | Exceptional 4.5% |
| Immigrants | Greece | 98.9 /100 | #81 | Exceptional 4.5% |
| Canadians | 98.8 /100 | #82 | Exceptional 4.5% |
| Immigrants | Denmark | 98.8 /100 | #83 | Exceptional 4.6% |
| Immigrants | Croatia | 98.7 /100 | #84 | Exceptional 4.6% |
| South Africans | 98.7 /100 | #85 | Exceptional 4.6% |
| Immigrants | Turkey | 98.6 /100 | #86 | Exceptional 4.6% |
| Immigrants | North Macedonia | 98.6 /100 | #87 | Exceptional 4.6% |
| Bolivians | 98.6 /100 | #88 | Exceptional 4.6% |
| Immigrants | Czechoslovakia | 98.5 /100 | #89 | Exceptional 4.6% |
| Immigrants | Switzerland | 98.5 /100 | #90 | Exceptional 4.6% |
| Basques | 98.5 /100 | #91 | Exceptional 4.6% |