Immigrants from Western Asia vs Immigrants from Turkey Female Poverty
COMPARE
Immigrants from Western Asia
Immigrants from Turkey
Female Poverty
Female Poverty Comparison
Immigrants from Western Asia
Immigrants from Turkey
13.9%
FEMALE POVERTY
20.7/ 100
METRIC RATING
203rd/ 347
METRIC RANK
12.6%
FEMALE POVERTY
93.8/ 100
METRIC RATING
106th/ 347
METRIC RANK
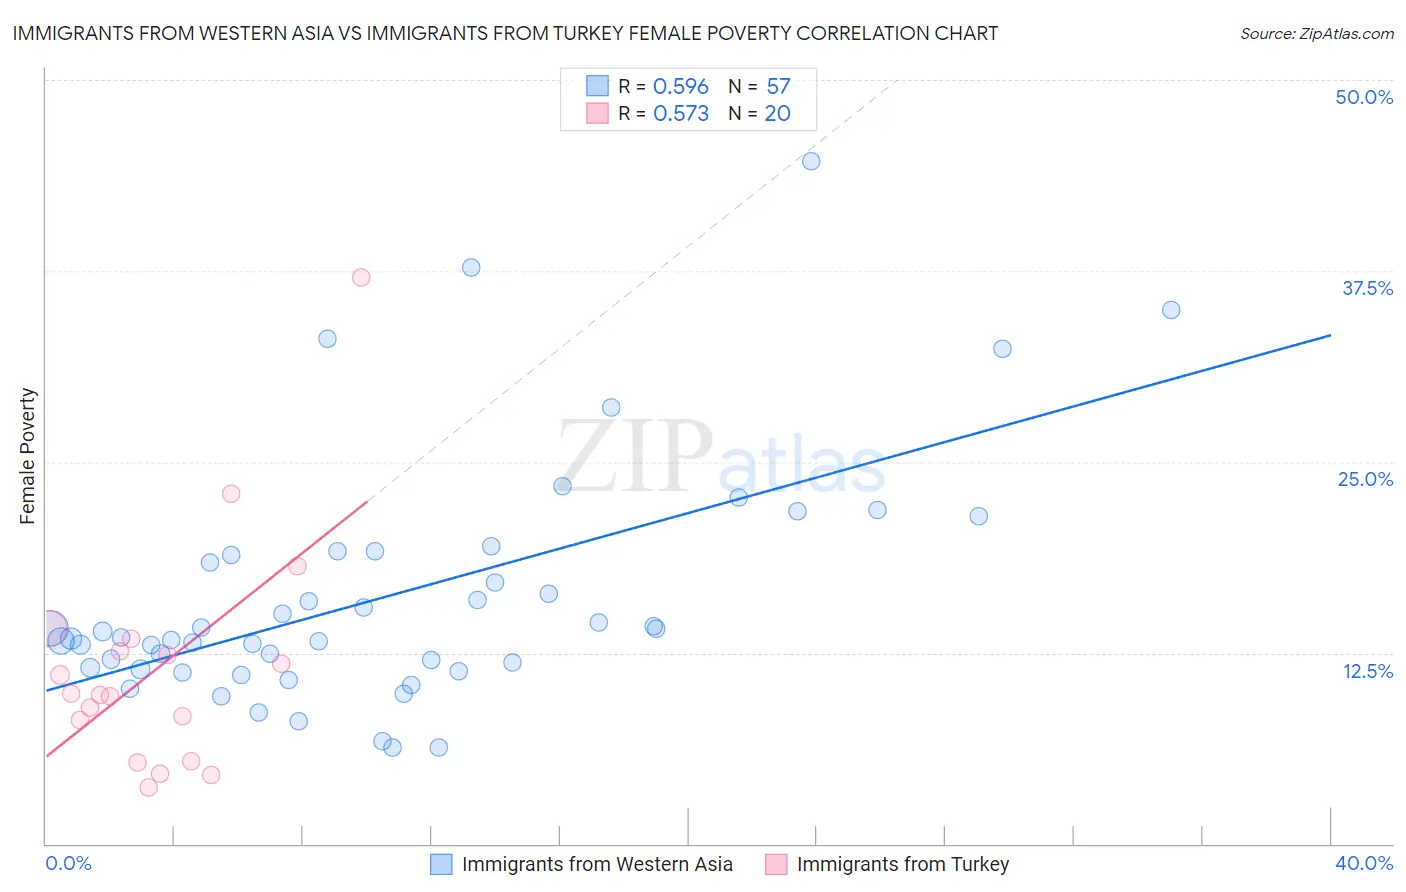
Immigrants from Western Asia vs Immigrants from Turkey Female Poverty Correlation Chart
The statistical analysis conducted on geographies consisting of 404,121,163 people shows a substantial positive correlation between the proportion of Immigrants from Western Asia and poverty level among females in the United States with a correlation coefficient (R) of 0.596 and weighted average of 13.9%. Similarly, the statistical analysis conducted on geographies consisting of 222,940,623 people shows a substantial positive correlation between the proportion of Immigrants from Turkey and poverty level among females in the United States with a correlation coefficient (R) of 0.573 and weighted average of 12.6%, a difference of 10.4%.
Female Poverty Correlation Summary
| Measurement | Immigrants from Western Asia | Immigrants from Turkey |
| Minimum | 6.3% | 3.7% |
| Maximum | 44.7% | 37.0% |
| Range | 38.4% | 33.3% |
| Mean | 16.2% | 11.6% |
| Median | 13.5% | 9.8% |
| Interquartile 25% (IQ1) | 11.5% | 6.7% |
| Interquartile 75% (IQ3) | 19.0% | 13.0% |
| Interquartile Range (IQR) | 7.6% | 6.2% |
| Standard Deviation (Sample) | 7.8% | 7.6% |
| Standard Deviation (Population) | 7.8% | 7.4% |
Similar Demographics by Female Poverty
Demographics Similar to Immigrants from Western Asia by Female Poverty
In terms of female poverty, the demographic groups most similar to Immigrants from Western Asia are Hmong (13.9%, a difference of 0.050%), Immigrants from Kenya (13.9%, a difference of 0.060%), Spanish (13.9%, a difference of 0.10%), Spaniard (13.9%, a difference of 0.27%), and Immigrants from Lebanon (13.8%, a difference of 0.65%).
| Demographics | Rating | Rank | Female Poverty |
| South American Indians | 28.9 /100 | #196 | Fair 13.7% |
| Arabs | 28.6 /100 | #197 | Fair 13.7% |
| Immigrants | Uganda | 28.5 /100 | #198 | Fair 13.7% |
| Immigrants | Lebanon | 25.6 /100 | #199 | Fair 13.8% |
| Spanish | 21.4 /100 | #200 | Fair 13.9% |
| Immigrants | Kenya | 21.1 /100 | #201 | Fair 13.9% |
| Hmong | 21.1 /100 | #202 | Fair 13.9% |
| Immigrants | Western Asia | 20.7 /100 | #203 | Fair 13.9% |
| Spaniards | 18.9 /100 | #204 | Poor 13.9% |
| Ugandans | 15.4 /100 | #205 | Poor 14.0% |
| Immigrants | Uruguay | 14.0 /100 | #206 | Poor 14.0% |
| Immigrants | Eastern Africa | 9.0 /100 | #207 | Tragic 14.2% |
| Immigrants | Azores | 7.9 /100 | #208 | Tragic 14.2% |
| Panamanians | 7.7 /100 | #209 | Tragic 14.2% |
| Malaysians | 7.4 /100 | #210 | Tragic 14.3% |
Demographics Similar to Immigrants from Turkey by Female Poverty
In terms of female poverty, the demographic groups most similar to Immigrants from Turkey are Scottish (12.5%, a difference of 0.12%), Laotian (12.6%, a difference of 0.19%), Palestinian (12.5%, a difference of 0.23%), Portuguese (12.6%, a difference of 0.29%), and Immigrants from Zimbabwe (12.6%, a difference of 0.31%).
| Demographics | Rating | Rank | Female Poverty |
| Romanians | 95.1 /100 | #99 | Exceptional 12.5% |
| Immigrants | Latvia | 94.8 /100 | #100 | Exceptional 12.5% |
| Tlingit-Haida | 94.8 /100 | #101 | Exceptional 12.5% |
| Immigrants | China | 94.5 /100 | #102 | Exceptional 12.5% |
| Slavs | 94.5 /100 | #103 | Exceptional 12.5% |
| Palestinians | 94.3 /100 | #104 | Exceptional 12.5% |
| Scottish | 94.1 /100 | #105 | Exceptional 12.5% |
| Immigrants | Turkey | 93.8 /100 | #106 | Exceptional 12.6% |
| Laotians | 93.4 /100 | #107 | Exceptional 12.6% |
| Portuguese | 93.1 /100 | #108 | Exceptional 12.6% |
| Immigrants | Zimbabwe | 93.1 /100 | #109 | Exceptional 12.6% |
| Paraguayans | 93.0 /100 | #110 | Exceptional 12.6% |
| Soviet Union | 92.4 /100 | #111 | Exceptional 12.6% |
| Immigrants | Israel | 92.0 /100 | #112 | Exceptional 12.6% |
| Canadians | 92.0 /100 | #113 | Exceptional 12.7% |