Immigrants from Peru vs Immigrants from Ecuador In Labor Force | Age 16-19
COMPARE
Immigrants from Peru
Immigrants from Ecuador
In Labor Force | Age 16-19
In Labor Force | Age 16-19 Comparison
Immigrants from Peru
Immigrants from Ecuador
34.2%
IN LABOR FORCE | AGE 16-19
0.5/ 100
METRIC RATING
267th/ 347
METRIC RANK
31.0%
IN LABOR FORCE | AGE 16-19
0.0/ 100
METRIC RATING
328th/ 347
METRIC RANK
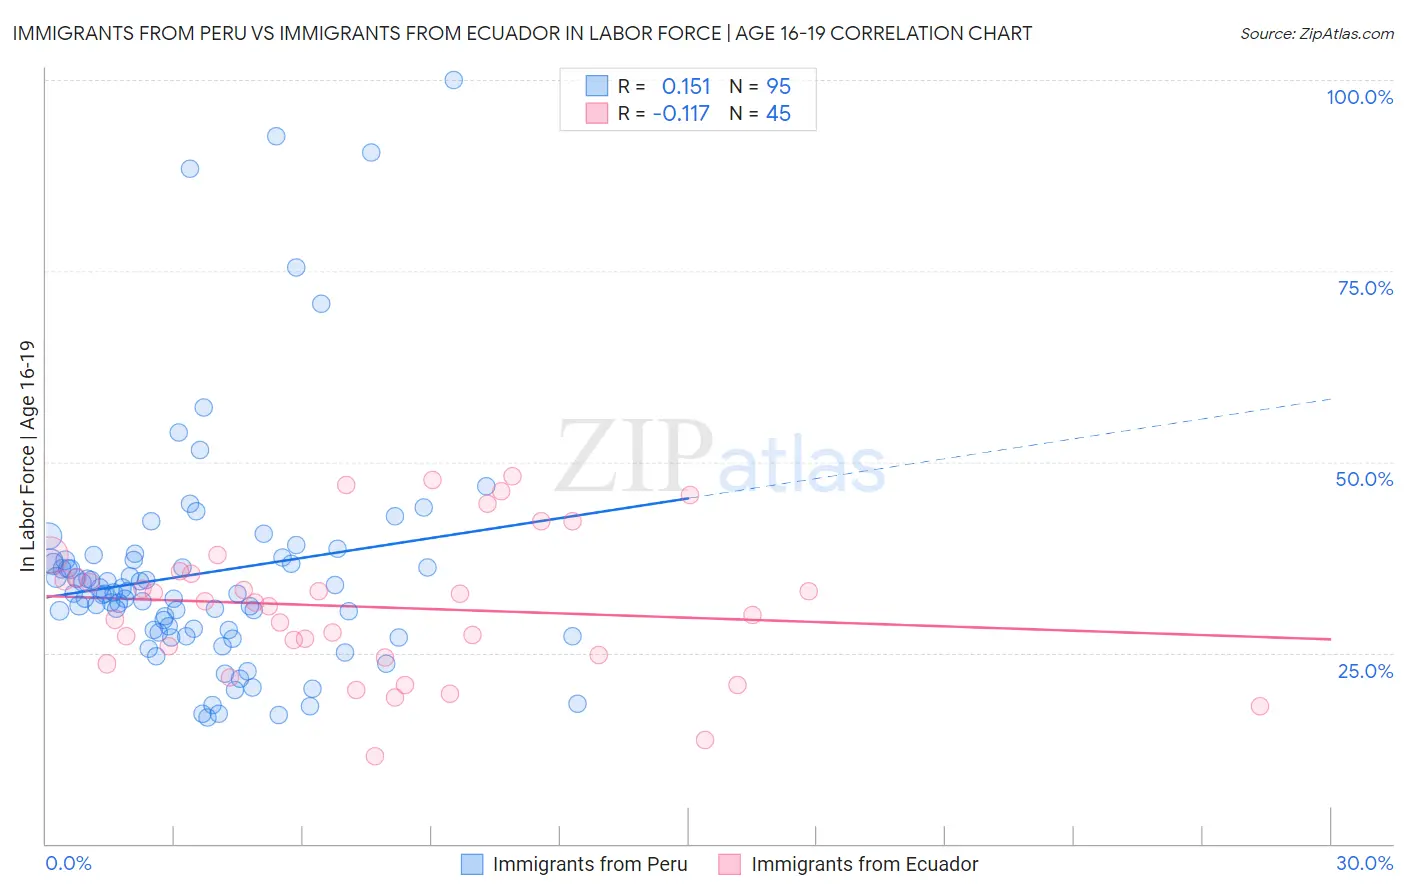
Immigrants from Peru vs Immigrants from Ecuador In Labor Force | Age 16-19 Correlation Chart
The statistical analysis conducted on geographies consisting of 328,524,721 people shows a poor positive correlation between the proportion of Immigrants from Peru and labor force participation rate among population between the ages 16 and 19 in the United States with a correlation coefficient (R) of 0.151 and weighted average of 34.2%. Similarly, the statistical analysis conducted on geographies consisting of 270,745,839 people shows a poor negative correlation between the proportion of Immigrants from Ecuador and labor force participation rate among population between the ages 16 and 19 in the United States with a correlation coefficient (R) of -0.117 and weighted average of 31.0%, a difference of 10.1%.
In Labor Force | Age 16-19 Correlation Summary
| Measurement | Immigrants from Peru | Immigrants from Ecuador |
| Minimum | 16.5% | 11.4% |
| Maximum | 100.0% | 48.1% |
| Range | 83.5% | 36.7% |
| Mean | 35.4% | 31.0% |
| Median | 32.8% | 31.6% |
| Interquartile 25% (IQ1) | 27.7% | 24.5% |
| Interquartile 75% (IQ3) | 37.1% | 35.6% |
| Interquartile Range (IQR) | 9.5% | 11.1% |
| Standard Deviation (Sample) | 15.6% | 9.2% |
| Standard Deviation (Population) | 15.5% | 9.1% |
Similar Demographics by In Labor Force | Age 16-19
Demographics Similar to Immigrants from Peru by In Labor Force | Age 16-19
In terms of in labor force | age 16-19, the demographic groups most similar to Immigrants from Peru are Immigrants from Asia (34.1%, a difference of 0.12%), Pima (34.1%, a difference of 0.20%), Immigrants from Russia (34.1%, a difference of 0.25%), Central American Indian (34.1%, a difference of 0.25%), and Asian (34.1%, a difference of 0.28%).
| Demographics | Rating | Rank | In Labor Force | Age 16-19 |
| Egyptians | 1.2 /100 | #260 | Tragic 34.5% |
| Salvadorans | 1.1 /100 | #261 | Tragic 34.5% |
| Hispanics or Latinos | 1.1 /100 | #262 | Tragic 34.5% |
| Burmese | 1.1 /100 | #263 | Tragic 34.5% |
| Immigrants | Uruguay | 0.9 /100 | #264 | Tragic 34.4% |
| Immigrants | El Salvador | 0.7 /100 | #265 | Tragic 34.3% |
| Immigrants | Malaysia | 0.7 /100 | #266 | Tragic 34.3% |
| Immigrants | Peru | 0.5 /100 | #267 | Tragic 34.2% |
| Immigrants | Asia | 0.5 /100 | #268 | Tragic 34.1% |
| Pima | 0.5 /100 | #269 | Tragic 34.1% |
| Immigrants | Russia | 0.4 /100 | #270 | Tragic 34.1% |
| Central American Indians | 0.4 /100 | #271 | Tragic 34.1% |
| Asians | 0.4 /100 | #272 | Tragic 34.1% |
| Immigrants | Panama | 0.4 /100 | #273 | Tragic 34.0% |
| Venezuelans | 0.3 /100 | #274 | Tragic 34.0% |
Demographics Similar to Immigrants from Ecuador by In Labor Force | Age 16-19
In terms of in labor force | age 16-19, the demographic groups most similar to Immigrants from Ecuador are Barbadian (31.0%, a difference of 0.030%), Immigrants from Taiwan (31.0%, a difference of 0.040%), Lumbee (31.0%, a difference of 0.15%), Immigrants from Dominican Republic (31.1%, a difference of 0.20%), and Trinidadian and Tobagonian (30.9%, a difference of 0.30%).
| Demographics | Rating | Rank | In Labor Force | Age 16-19 |
| West Indians | 0.0 /100 | #321 | Tragic 31.3% |
| Tohono O'odham | 0.0 /100 | #322 | Tragic 31.3% |
| Immigrants | Caribbean | 0.0 /100 | #323 | Tragic 31.2% |
| Dominicans | 0.0 /100 | #324 | Tragic 31.2% |
| Immigrants | China | 0.0 /100 | #325 | Tragic 31.1% |
| Immigrants | Dominican Republic | 0.0 /100 | #326 | Tragic 31.1% |
| Immigrants | Taiwan | 0.0 /100 | #327 | Tragic 31.0% |
| Immigrants | Ecuador | 0.0 /100 | #328 | Tragic 31.0% |
| Barbadians | 0.0 /100 | #329 | Tragic 31.0% |
| Lumbee | 0.0 /100 | #330 | Tragic 31.0% |
| Trinidadians and Tobagonians | 0.0 /100 | #331 | Tragic 30.9% |
| Immigrants | Israel | 0.0 /100 | #332 | Tragic 30.5% |
| Immigrants | Hong Kong | 0.0 /100 | #333 | Tragic 30.5% |
| Puerto Ricans | 0.0 /100 | #334 | Tragic 30.3% |
| Immigrants | Cuba | 0.0 /100 | #335 | Tragic 30.2% |