Immigrants from Cuba vs Immigrants from Ecuador Female Poverty
COMPARE
Immigrants from Cuba
Immigrants from Ecuador
Female Poverty
Female Poverty Comparison
Immigrants from Cuba
Immigrants from Ecuador
16.1%
FEMALE POVERTY
0.0/ 100
METRIC RATING
283rd/ 347
METRIC RANK
15.6%
FEMALE POVERTY
0.1/ 100
METRIC RATING
264th/ 347
METRIC RANK
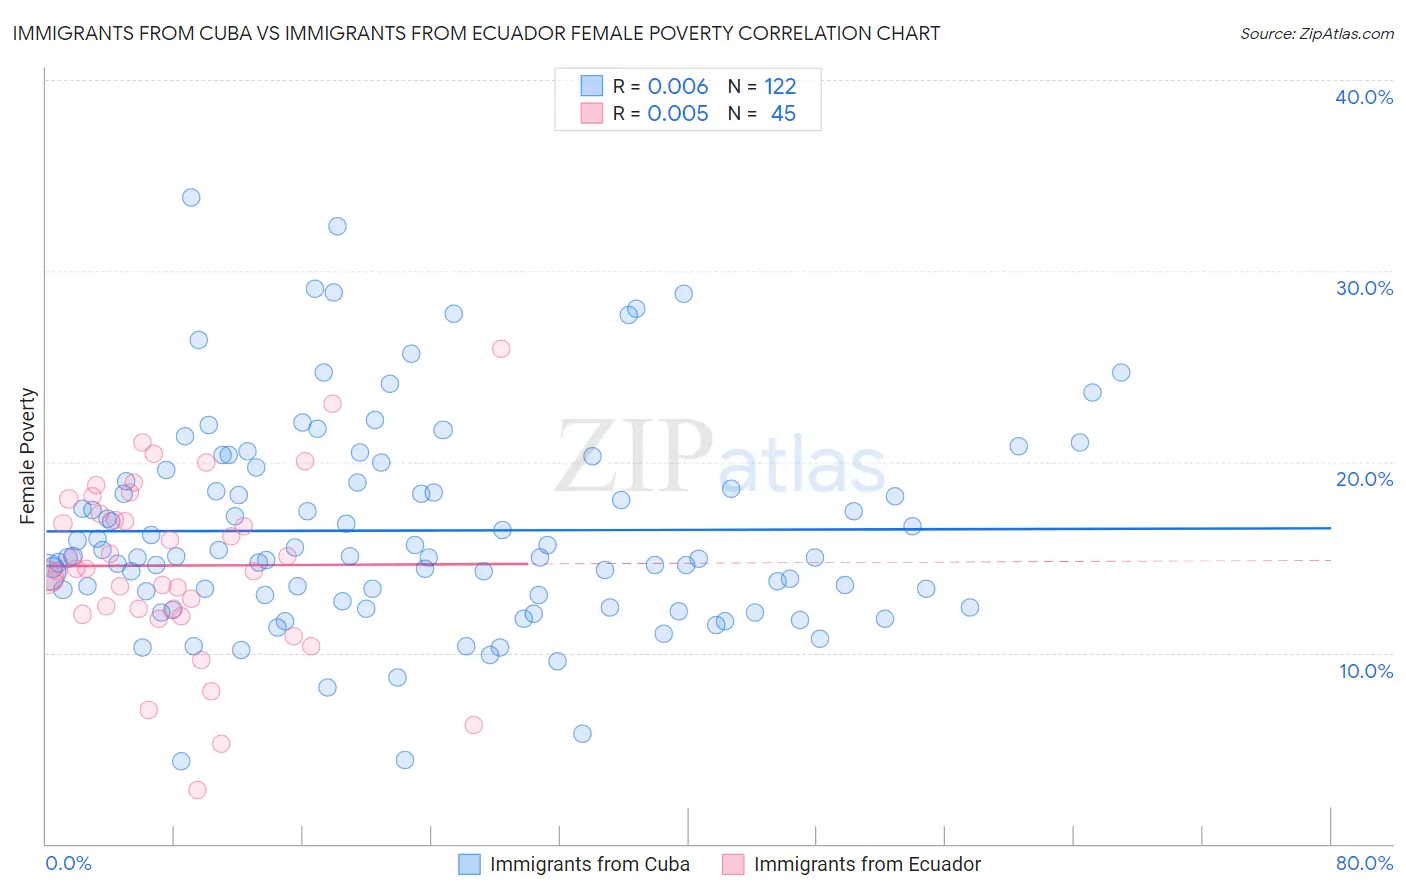
Immigrants from Cuba vs Immigrants from Ecuador Female Poverty Correlation Chart
The statistical analysis conducted on geographies consisting of 325,939,480 people shows no correlation between the proportion of Immigrants from Cuba and poverty level among females in the United States with a correlation coefficient (R) of 0.006 and weighted average of 16.1%. Similarly, the statistical analysis conducted on geographies consisting of 270,847,702 people shows no correlation between the proportion of Immigrants from Ecuador and poverty level among females in the United States with a correlation coefficient (R) of 0.005 and weighted average of 15.6%, a difference of 3.3%.
Female Poverty Correlation Summary
| Measurement | Immigrants from Cuba | Immigrants from Ecuador |
| Minimum | 4.3% | 2.8% |
| Maximum | 33.8% | 25.9% |
| Range | 29.5% | 23.1% |
| Mean | 16.4% | 14.6% |
| Median | 15.0% | 14.4% |
| Interquartile 25% (IQ1) | 13.0% | 12.2% |
| Interquartile 75% (IQ3) | 19.0% | 17.7% |
| Interquartile Range (IQR) | 6.0% | 5.5% |
| Standard Deviation (Sample) | 5.5% | 4.6% |
| Standard Deviation (Population) | 5.4% | 4.6% |
Demographics Similar to Immigrants from Cuba and Immigrants from Ecuador by Female Poverty
In terms of female poverty, the demographic groups most similar to Immigrants from Cuba are Immigrants from Haiti (16.1%, a difference of 0.080%), West Indian (16.1%, a difference of 0.24%), Vietnamese (16.1%, a difference of 0.26%), Immigrants from Bahamas (16.1%, a difference of 0.49%), and Immigrants from West Indies (16.1%, a difference of 0.61%). Similarly, the demographic groups most similar to Immigrants from Ecuador are Cherokee (15.6%, a difference of 0.13%), Immigrants from Liberia (15.7%, a difference of 0.30%), Immigrants from El Salvador (15.7%, a difference of 0.36%), Subsaharan African (15.8%, a difference of 0.79%), and Immigrants from Nicaragua (15.8%, a difference of 0.85%).
| Demographics | Rating | Rank | Female Poverty |
| Cherokee | 0.1 /100 | #263 | Tragic 15.6% |
| Immigrants | Ecuador | 0.1 /100 | #264 | Tragic 15.6% |
| Immigrants | Liberia | 0.1 /100 | #265 | Tragic 15.7% |
| Immigrants | El Salvador | 0.1 /100 | #266 | Tragic 15.7% |
| Sub-Saharan Africans | 0.1 /100 | #267 | Tragic 15.8% |
| Immigrants | Nicaragua | 0.1 /100 | #268 | Tragic 15.8% |
| Iroquois | 0.1 /100 | #269 | Tragic 15.8% |
| Chickasaw | 0.1 /100 | #270 | Tragic 15.9% |
| Immigrants | St. Vincent and the Grenadines | 0.0 /100 | #271 | Tragic 15.9% |
| Belizeans | 0.0 /100 | #272 | Tragic 15.9% |
| Haitians | 0.0 /100 | #273 | Tragic 15.9% |
| Barbadians | 0.0 /100 | #274 | Tragic 15.9% |
| Immigrants | Barbados | 0.0 /100 | #275 | Tragic 16.0% |
| Central Americans | 0.0 /100 | #276 | Tragic 16.0% |
| Bangladeshis | 0.0 /100 | #277 | Tragic 16.0% |
| Immigrants | West Indies | 0.0 /100 | #278 | Tragic 16.1% |
| Immigrants | Bahamas | 0.0 /100 | #279 | Tragic 16.1% |
| Vietnamese | 0.0 /100 | #280 | Tragic 16.1% |
| West Indians | 0.0 /100 | #281 | Tragic 16.1% |
| Immigrants | Haiti | 0.0 /100 | #282 | Tragic 16.1% |
| Immigrants | Cuba | 0.0 /100 | #283 | Tragic 16.1% |