Immigrants from Peru vs Czech Child Poverty Among Girls Under 16
COMPARE
Immigrants from Peru
Czech
Child Poverty Among Girls Under 16
Child Poverty Among Girls Under 16 Comparison
Immigrants from Peru
Czechs
15.6%
CHILD POVERTY AMONG GIRLS UNDER 16
86.6/ 100
METRIC RATING
143rd/ 347
METRIC RANK
14.2%
CHILD POVERTY AMONG GIRLS UNDER 16
99.3/ 100
METRIC RATING
48th/ 347
METRIC RANK
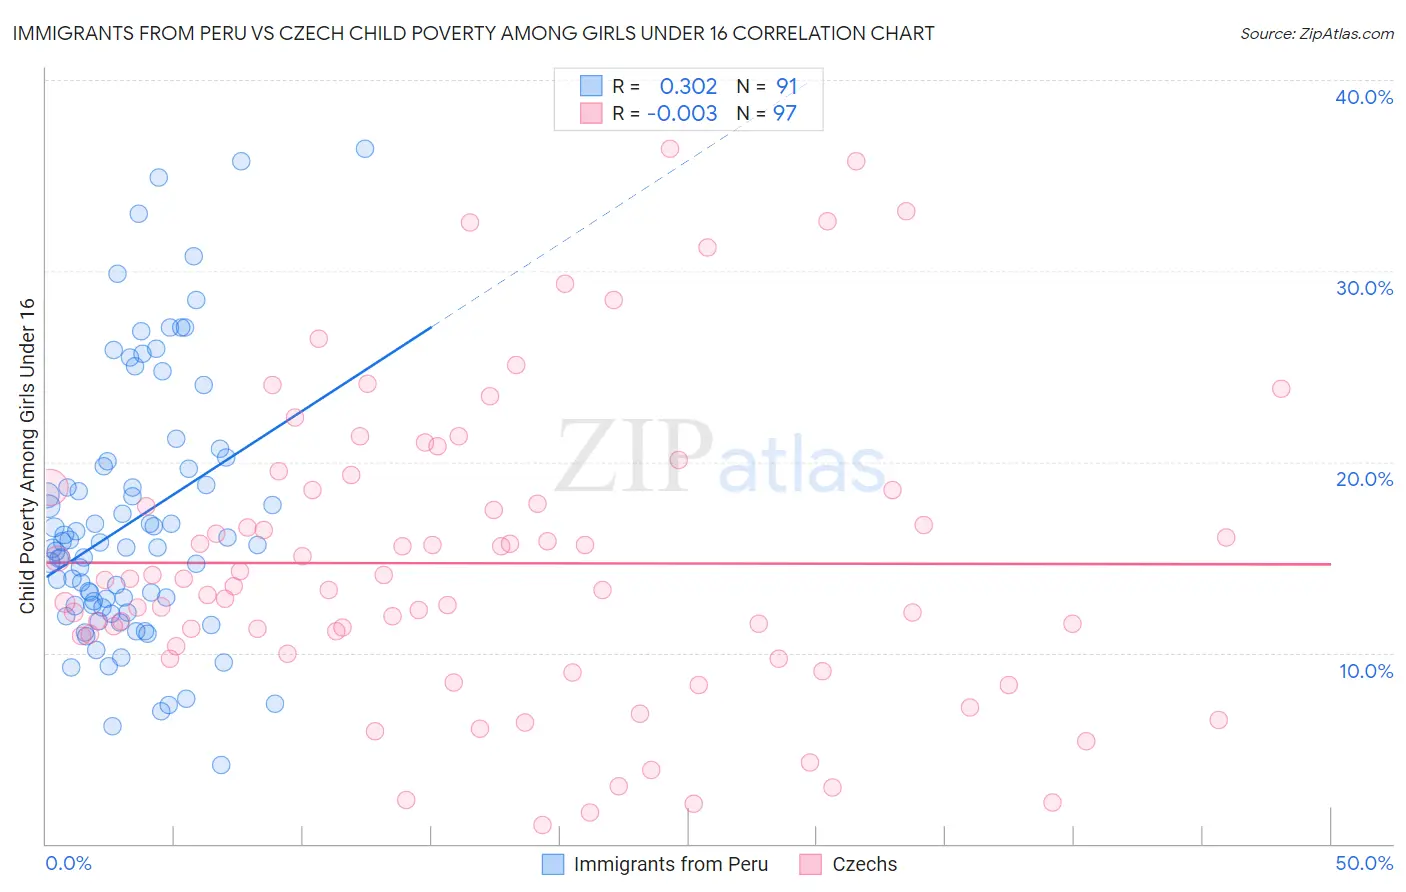
Immigrants from Peru vs Czech Child Poverty Among Girls Under 16 Correlation Chart
The statistical analysis conducted on geographies consisting of 324,394,048 people shows a mild positive correlation between the proportion of Immigrants from Peru and poverty level among girls under the age of 16 in the United States with a correlation coefficient (R) of 0.302 and weighted average of 15.6%. Similarly, the statistical analysis conducted on geographies consisting of 470,185,036 people shows no correlation between the proportion of Czechs and poverty level among girls under the age of 16 in the United States with a correlation coefficient (R) of -0.003 and weighted average of 14.2%, a difference of 10.1%.
Child Poverty Among Girls Under 16 Correlation Summary
| Measurement | Immigrants from Peru | Czech |
| Minimum | 4.1% | 0.95% |
| Maximum | 36.4% | 36.4% |
| Range | 32.3% | 35.4% |
| Mean | 16.9% | 14.7% |
| Median | 15.5% | 13.5% |
| Interquartile 25% (IQ1) | 12.4% | 10.1% |
| Interquartile 75% (IQ3) | 19.8% | 18.5% |
| Interquartile Range (IQR) | 7.4% | 8.4% |
| Standard Deviation (Sample) | 6.9% | 7.8% |
| Standard Deviation (Population) | 6.9% | 7.8% |
Similar Demographics by Child Poverty Among Girls Under 16
Demographics Similar to Immigrants from Peru by Child Poverty Among Girls Under 16
In terms of child poverty among girls under 16, the demographic groups most similar to Immigrants from Peru are Israeli (15.6%, a difference of 0.090%), Canadian (15.6%, a difference of 0.15%), Immigrants from Jordan (15.6%, a difference of 0.17%), New Zealander (15.6%, a difference of 0.18%), and Welsh (15.6%, a difference of 0.29%).
| Demographics | Rating | Rank | Child Poverty Among Girls Under 16 |
| Native Hawaiians | 89.0 /100 | #136 | Excellent 15.5% |
| South Africans | 88.7 /100 | #137 | Excellent 15.5% |
| Immigrants | Vietnam | 88.2 /100 | #138 | Excellent 15.5% |
| Armenians | 87.9 /100 | #139 | Excellent 15.5% |
| New Zealanders | 87.2 /100 | #140 | Excellent 15.6% |
| Immigrants | Jordan | 87.2 /100 | #141 | Excellent 15.6% |
| Canadians | 87.1 /100 | #142 | Excellent 15.6% |
| Immigrants | Peru | 86.6 /100 | #143 | Excellent 15.6% |
| Israelis | 86.3 /100 | #144 | Excellent 15.6% |
| Welsh | 85.4 /100 | #145 | Excellent 15.6% |
| Samoans | 84.2 /100 | #146 | Excellent 15.7% |
| Slavs | 83.1 /100 | #147 | Excellent 15.7% |
| Icelanders | 82.4 /100 | #148 | Excellent 15.7% |
| Immigrants | Hungary | 80.9 /100 | #149 | Excellent 15.8% |
| Immigrants | Albania | 80.7 /100 | #150 | Excellent 15.8% |
Demographics Similar to Czechs by Child Poverty Among Girls Under 16
In terms of child poverty among girls under 16, the demographic groups most similar to Czechs are Immigrants from Czechoslovakia (14.2%, a difference of 0.020%), Croatian (14.1%, a difference of 0.040%), Greek (14.2%, a difference of 0.040%), Immigrants from Greece (14.1%, a difference of 0.070%), and Immigrants from Israel (14.2%, a difference of 0.11%).
| Demographics | Rating | Rank | Child Poverty Among Girls Under 16 |
| Immigrants | Bolivia | 99.5 /100 | #41 | Exceptional 14.0% |
| Immigrants | Scotland | 99.4 /100 | #42 | Exceptional 14.0% |
| Koreans | 99.4 /100 | #43 | Exceptional 14.1% |
| Immigrants | Asia | 99.4 /100 | #44 | Exceptional 14.1% |
| Immigrants | Greece | 99.3 /100 | #45 | Exceptional 14.1% |
| Croatians | 99.3 /100 | #46 | Exceptional 14.1% |
| Immigrants | Czechoslovakia | 99.3 /100 | #47 | Exceptional 14.2% |
| Czechs | 99.3 /100 | #48 | Exceptional 14.2% |
| Greeks | 99.2 /100 | #49 | Exceptional 14.2% |
| Immigrants | Israel | 99.2 /100 | #50 | Exceptional 14.2% |
| Immigrants | Pakistan | 99.1 /100 | #51 | Exceptional 14.2% |
| Italians | 99.1 /100 | #52 | Exceptional 14.3% |
| Luxembourgers | 99.0 /100 | #53 | Exceptional 14.3% |
| Estonians | 98.9 /100 | #54 | Exceptional 14.3% |
| Immigrants | Romania | 98.9 /100 | #55 | Exceptional 14.3% |