Immigrants from Peru vs Immigrants from Latin America Child Poverty Among Girls Under 16
COMPARE
Immigrants from Peru
Immigrants from Latin America
Child Poverty Among Girls Under 16
Child Poverty Among Girls Under 16 Comparison
Immigrants from Peru
Immigrants from Latin America
15.6%
CHILD POVERTY AMONG GIRLS UNDER 16
86.6/ 100
METRIC RATING
143rd/ 347
METRIC RANK
20.6%
CHILD POVERTY AMONG GIRLS UNDER 16
0.0/ 100
METRIC RATING
292nd/ 347
METRIC RANK
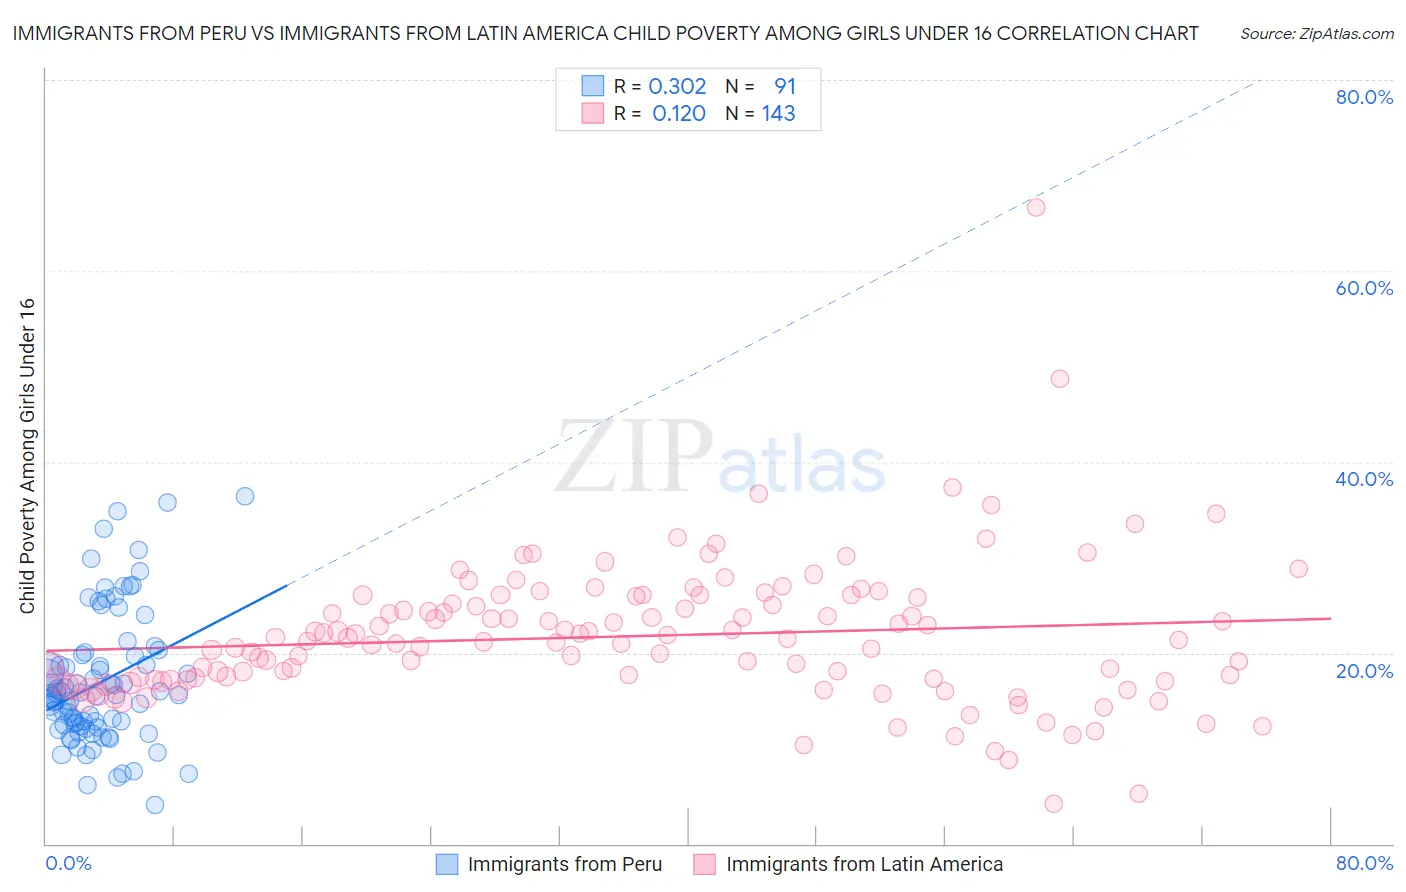
Immigrants from Peru vs Immigrants from Latin America Child Poverty Among Girls Under 16 Correlation Chart
The statistical analysis conducted on geographies consisting of 324,394,048 people shows a mild positive correlation between the proportion of Immigrants from Peru and poverty level among girls under the age of 16 in the United States with a correlation coefficient (R) of 0.302 and weighted average of 15.6%. Similarly, the statistical analysis conducted on geographies consisting of 539,700,311 people shows a poor positive correlation between the proportion of Immigrants from Latin America and poverty level among girls under the age of 16 in the United States with a correlation coefficient (R) of 0.120 and weighted average of 20.6%, a difference of 32.5%.
Child Poverty Among Girls Under 16 Correlation Summary
| Measurement | Immigrants from Peru | Immigrants from Latin America |
| Minimum | 4.1% | 4.2% |
| Maximum | 36.4% | 66.7% |
| Range | 32.3% | 62.5% |
| Mean | 16.9% | 21.7% |
| Median | 15.5% | 21.2% |
| Interquartile 25% (IQ1) | 12.4% | 17.2% |
| Interquartile 75% (IQ3) | 19.8% | 25.9% |
| Interquartile Range (IQR) | 7.4% | 8.7% |
| Standard Deviation (Sample) | 6.9% | 7.5% |
| Standard Deviation (Population) | 6.9% | 7.5% |
Similar Demographics by Child Poverty Among Girls Under 16
Demographics Similar to Immigrants from Peru by Child Poverty Among Girls Under 16
In terms of child poverty among girls under 16, the demographic groups most similar to Immigrants from Peru are Israeli (15.6%, a difference of 0.090%), Canadian (15.6%, a difference of 0.15%), Immigrants from Jordan (15.6%, a difference of 0.17%), New Zealander (15.6%, a difference of 0.18%), and Welsh (15.6%, a difference of 0.29%).
| Demographics | Rating | Rank | Child Poverty Among Girls Under 16 |
| Native Hawaiians | 89.0 /100 | #136 | Excellent 15.5% |
| South Africans | 88.7 /100 | #137 | Excellent 15.5% |
| Immigrants | Vietnam | 88.2 /100 | #138 | Excellent 15.5% |
| Armenians | 87.9 /100 | #139 | Excellent 15.5% |
| New Zealanders | 87.2 /100 | #140 | Excellent 15.6% |
| Immigrants | Jordan | 87.2 /100 | #141 | Excellent 15.6% |
| Canadians | 87.1 /100 | #142 | Excellent 15.6% |
| Immigrants | Peru | 86.6 /100 | #143 | Excellent 15.6% |
| Israelis | 86.3 /100 | #144 | Excellent 15.6% |
| Welsh | 85.4 /100 | #145 | Excellent 15.6% |
| Samoans | 84.2 /100 | #146 | Excellent 15.7% |
| Slavs | 83.1 /100 | #147 | Excellent 15.7% |
| Icelanders | 82.4 /100 | #148 | Excellent 15.7% |
| Immigrants | Hungary | 80.9 /100 | #149 | Excellent 15.8% |
| Immigrants | Albania | 80.7 /100 | #150 | Excellent 15.8% |
Demographics Similar to Immigrants from Latin America by Child Poverty Among Girls Under 16
In terms of child poverty among girls under 16, the demographic groups most similar to Immigrants from Latin America are Immigrants from Grenada (20.7%, a difference of 0.040%), Chippewa (20.6%, a difference of 0.070%), Immigrants from Senegal (20.7%, a difference of 0.15%), Immigrants from Caribbean (20.7%, a difference of 0.19%), and Immigrants from Haiti (20.6%, a difference of 0.20%).
| Demographics | Rating | Rank | Child Poverty Among Girls Under 16 |
| Immigrants | Cabo Verde | 0.0 /100 | #285 | Tragic 20.3% |
| Iroquois | 0.0 /100 | #286 | Tragic 20.4% |
| Blackfeet | 0.0 /100 | #287 | Tragic 20.5% |
| Haitians | 0.0 /100 | #288 | Tragic 20.5% |
| Immigrants | Belize | 0.0 /100 | #289 | Tragic 20.6% |
| Immigrants | Haiti | 0.0 /100 | #290 | Tragic 20.6% |
| Chippewa | 0.0 /100 | #291 | Tragic 20.6% |
| Immigrants | Latin America | 0.0 /100 | #292 | Tragic 20.6% |
| Immigrants | Grenada | 0.0 /100 | #293 | Tragic 20.7% |
| Immigrants | Senegal | 0.0 /100 | #294 | Tragic 20.7% |
| Immigrants | Caribbean | 0.0 /100 | #295 | Tragic 20.7% |
| Immigrants | West Indies | 0.0 /100 | #296 | Tragic 20.7% |
| Inupiat | 0.0 /100 | #297 | Tragic 20.8% |
| Mexicans | 0.0 /100 | #298 | Tragic 20.9% |
| Hispanics or Latinos | 0.0 /100 | #299 | Tragic 21.0% |