Immigrants from Northern Europe vs Immigrants from Ethiopia Unemployment Among Women with Children Ages 6 to 17 years
COMPARE
Immigrants from Northern Europe
Immigrants from Ethiopia
Unemployment Among Women with Children Ages 6 to 17 years
Unemployment Among Women with Children Ages 6 to 17 years Comparison
Immigrants from Northern Europe
Immigrants from Ethiopia
8.9%
UNEMPLOYMENT AMONG WOMEN WITH CHILDREN AGES 6 TO 17 YEARS
74.6/ 100
METRIC RATING
152nd/ 347
METRIC RANK
8.8%
UNEMPLOYMENT AMONG WOMEN WITH CHILDREN AGES 6 TO 17 YEARS
89.5/ 100
METRIC RATING
138th/ 347
METRIC RANK
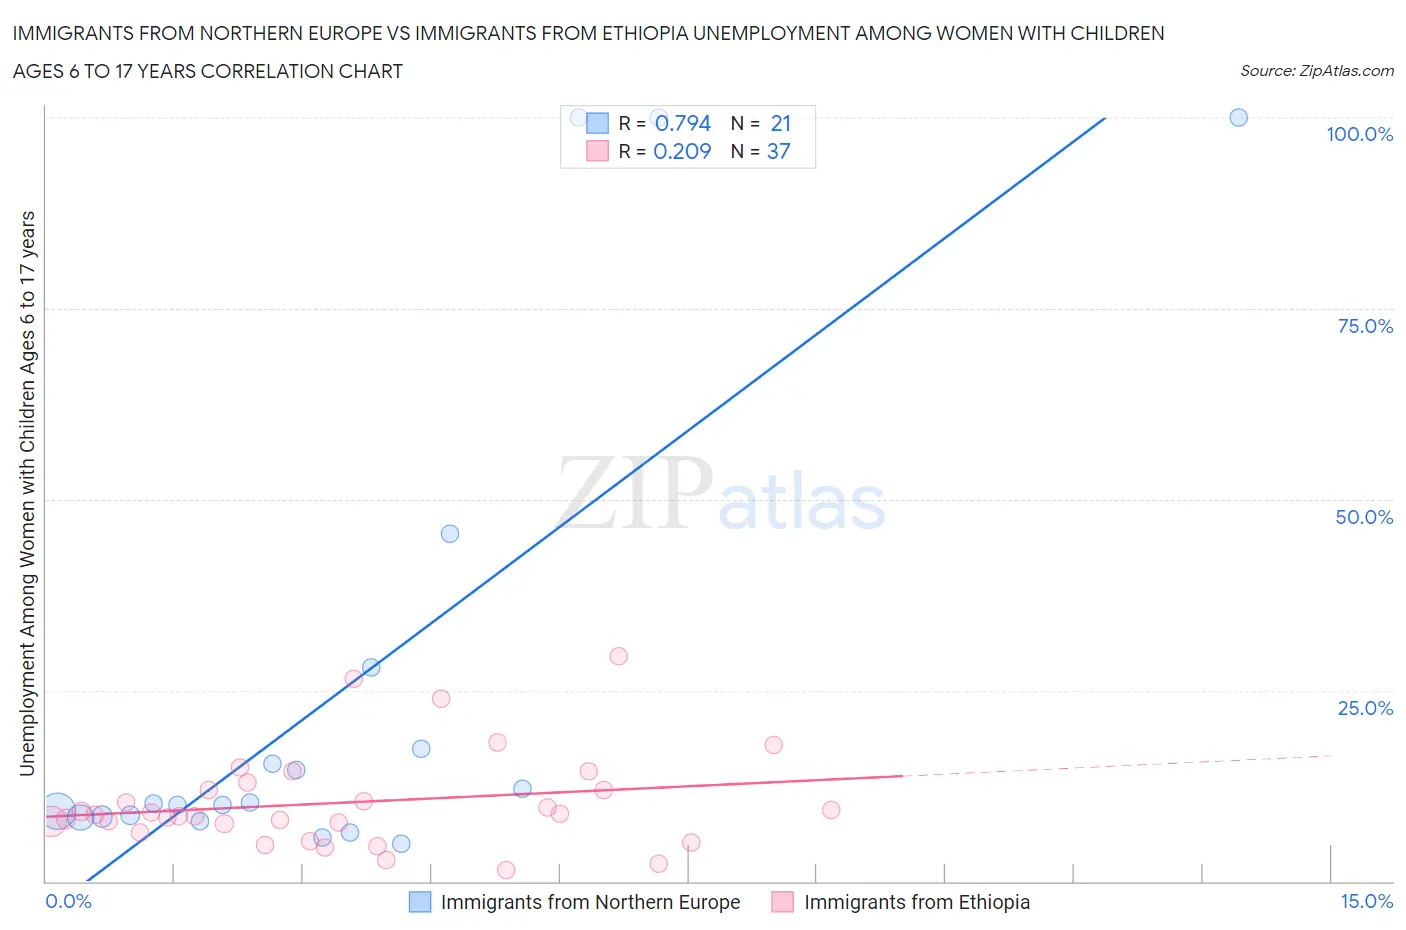
Immigrants from Northern Europe vs Immigrants from Ethiopia Unemployment Among Women with Children Ages 6 to 17 years Correlation Chart
The statistical analysis conducted on geographies consisting of 322,644,598 people shows a strong positive correlation between the proportion of Immigrants from Northern Europe and unemployment rate among women with children between the ages 6 and 17 in the United States with a correlation coefficient (R) of 0.794 and weighted average of 8.9%. Similarly, the statistical analysis conducted on geographies consisting of 171,824,978 people shows a weak positive correlation between the proportion of Immigrants from Ethiopia and unemployment rate among women with children between the ages 6 and 17 in the United States with a correlation coefficient (R) of 0.209 and weighted average of 8.8%, a difference of 1.2%.
Unemployment Among Women with Children Ages 6 to 17 years Correlation Summary
| Measurement | Immigrants from Northern Europe | Immigrants from Ethiopia |
| Minimum | 4.9% | 1.4% |
| Maximum | 100.0% | 29.5% |
| Range | 95.1% | 28.1% |
| Mean | 25.4% | 10.3% |
| Median | 10.1% | 8.8% |
| Interquartile 25% (IQ1) | 8.4% | 7.0% |
| Interquartile 75% (IQ3) | 22.7% | 12.5% |
| Interquartile Range (IQR) | 14.3% | 5.5% |
| Standard Deviation (Sample) | 32.5% | 6.3% |
| Standard Deviation (Population) | 31.7% | 6.2% |
Demographics Similar to Immigrants from Northern Europe and Immigrants from Ethiopia by Unemployment Among Women with Children Ages 6 to 17 years
In terms of unemployment among women with children ages 6 to 17 years, the demographic groups most similar to Immigrants from Northern Europe are Immigrants from Eastern Africa (8.9%, a difference of 0.0%), Greek (8.9%, a difference of 0.040%), Immigrants from Europe (8.9%, a difference of 0.070%), Croatian (8.8%, a difference of 0.090%), and Vietnamese (8.9%, a difference of 0.14%). Similarly, the demographic groups most similar to Immigrants from Ethiopia are Northern European (8.8%, a difference of 0.030%), Immigrants from Argentina (8.7%, a difference of 0.060%), Immigrants from Latvia (8.7%, a difference of 0.11%), European (8.7%, a difference of 0.14%), and Immigrants from Poland (8.8%, a difference of 0.14%).
| Demographics | Rating | Rank | Unemployment Among Women with Children Ages 6 to 17 years |
| Europeans | 90.6 /100 | #135 | Exceptional 8.7% |
| Immigrants | Latvia | 90.4 /100 | #136 | Exceptional 8.7% |
| Immigrants | Argentina | 90.0 /100 | #137 | Excellent 8.7% |
| Immigrants | Ethiopia | 89.5 /100 | #138 | Excellent 8.8% |
| Northern Europeans | 89.2 /100 | #139 | Excellent 8.8% |
| Immigrants | Poland | 88.3 /100 | #140 | Excellent 8.8% |
| Serbians | 87.6 /100 | #141 | Excellent 8.8% |
| Immigrants | Austria | 87.5 /100 | #142 | Excellent 8.8% |
| Immigrants | Kenya | 86.1 /100 | #143 | Excellent 8.8% |
| Russians | 85.8 /100 | #144 | Excellent 8.8% |
| Kenyans | 85.6 /100 | #145 | Excellent 8.8% |
| Chileans | 80.8 /100 | #146 | Excellent 8.8% |
| Immigrants | Bangladesh | 79.4 /100 | #147 | Good 8.8% |
| Costa Ricans | 77.0 /100 | #148 | Good 8.8% |
| Croatians | 76.0 /100 | #149 | Good 8.8% |
| Greeks | 75.2 /100 | #150 | Good 8.9% |
| Immigrants | Eastern Africa | 74.6 /100 | #151 | Good 8.9% |
| Immigrants | Northern Europe | 74.6 /100 | #152 | Good 8.9% |
| Immigrants | Europe | 73.4 /100 | #153 | Good 8.9% |
| Vietnamese | 72.1 /100 | #154 | Good 8.9% |
| Immigrants | Greece | 71.8 /100 | #155 | Good 8.9% |