Immigrants from Middle Africa vs Immigrants from Iran Single Female Poverty
COMPARE
Immigrants from Middle Africa
Immigrants from Iran
Single Female Poverty
Single Female Poverty Comparison
Immigrants from Middle Africa
Immigrants from Iran
22.3%
SINGLE FEMALE POVERTY
1.9/ 100
METRIC RATING
244th/ 347
METRIC RANK
17.5%
SINGLE FEMALE POVERTY
100.0/ 100
METRIC RATING
8th/ 347
METRIC RANK
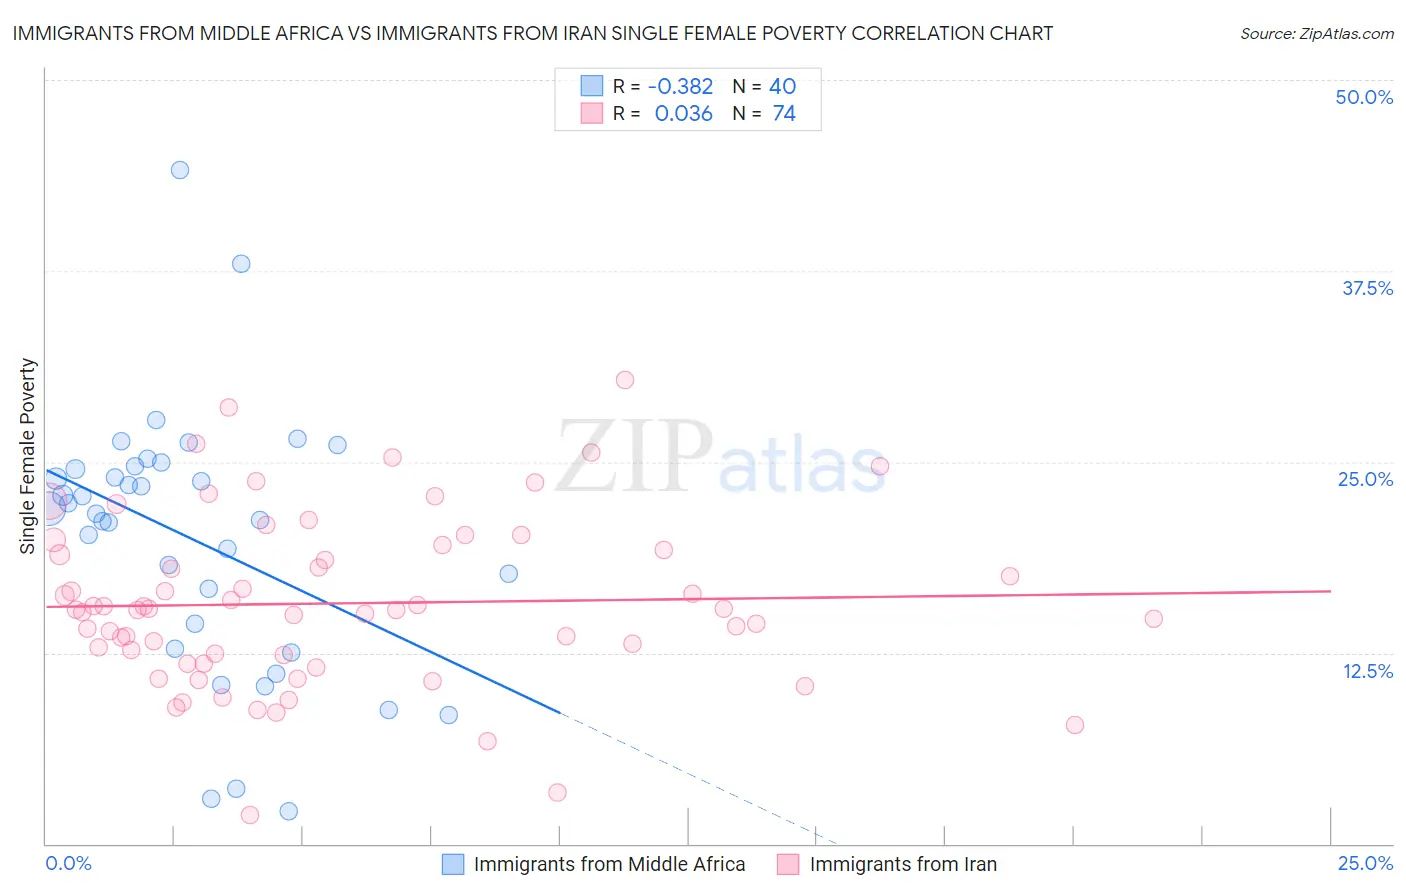
Immigrants from Middle Africa vs Immigrants from Iran Single Female Poverty Correlation Chart
The statistical analysis conducted on geographies consisting of 201,606,644 people shows a mild negative correlation between the proportion of Immigrants from Middle Africa and poverty level among single females in the United States with a correlation coefficient (R) of -0.382 and weighted average of 22.3%. Similarly, the statistical analysis conducted on geographies consisting of 276,267,918 people shows no correlation between the proportion of Immigrants from Iran and poverty level among single females in the United States with a correlation coefficient (R) of 0.036 and weighted average of 17.5%, a difference of 27.8%.
Single Female Poverty Correlation Summary
| Measurement | Immigrants from Middle Africa | Immigrants from Iran |
| Minimum | 2.2% | 1.9% |
| Maximum | 44.1% | 30.4% |
| Range | 42.0% | 28.5% |
| Mean | 19.9% | 15.7% |
| Median | 21.8% | 15.3% |
| Interquartile 25% (IQ1) | 13.6% | 12.3% |
| Interquartile 75% (IQ3) | 24.6% | 19.3% |
| Interquartile Range (IQR) | 11.1% | 6.9% |
| Standard Deviation (Sample) | 8.6% | 5.6% |
| Standard Deviation (Population) | 8.5% | 5.5% |
Similar Demographics by Single Female Poverty
Demographics Similar to Immigrants from Middle Africa by Single Female Poverty
In terms of single female poverty, the demographic groups most similar to Immigrants from Middle Africa are West Indian (22.3%, a difference of 0.010%), Immigrants from Bangladesh (22.3%, a difference of 0.040%), Bermudan (22.3%, a difference of 0.10%), Cape Verdean (22.3%, a difference of 0.17%), and French (22.2%, a difference of 0.31%).
| Demographics | Rating | Rank | Single Female Poverty |
| Vietnamese | 4.0 /100 | #237 | Tragic 22.0% |
| French Canadians | 2.8 /100 | #238 | Tragic 22.2% |
| Malaysians | 2.8 /100 | #239 | Tragic 22.2% |
| French | 2.3 /100 | #240 | Tragic 22.2% |
| Cape Verdeans | 2.1 /100 | #241 | Tragic 22.3% |
| Bermudans | 2.0 /100 | #242 | Tragic 22.3% |
| West Indians | 1.9 /100 | #243 | Tragic 22.3% |
| Immigrants | Middle Africa | 1.9 /100 | #244 | Tragic 22.3% |
| Immigrants | Bangladesh | 1.8 /100 | #245 | Tragic 22.3% |
| Liberians | 1.4 /100 | #246 | Tragic 22.4% |
| Immigrants | El Salvador | 1.4 /100 | #247 | Tragic 22.4% |
| Belizeans | 1.4 /100 | #248 | Tragic 22.4% |
| Immigrants | Caribbean | 1.3 /100 | #249 | Tragic 22.4% |
| Immigrants | Bahamas | 1.2 /100 | #250 | Tragic 22.5% |
| Immigrants | West Indies | 1.0 /100 | #251 | Tragic 22.5% |
Demographics Similar to Immigrants from Iran by Single Female Poverty
In terms of single female poverty, the demographic groups most similar to Immigrants from Iran are Thai (17.3%, a difference of 0.99%), Bhutanese (17.7%, a difference of 1.4%), Immigrants from Ireland (17.8%, a difference of 1.8%), Immigrants from Lithuania (17.8%, a difference of 1.9%), and Immigrants from South Central Asia (17.8%, a difference of 2.0%).
| Demographics | Rating | Rank | Single Female Poverty |
| Chinese | 100.0 /100 | #1 | Exceptional 16.1% |
| Immigrants | Taiwan | 100.0 /100 | #2 | Exceptional 16.4% |
| Immigrants | Hong Kong | 100.0 /100 | #3 | Exceptional 16.5% |
| Immigrants | India | 100.0 /100 | #4 | Exceptional 16.8% |
| Assyrians/Chaldeans/Syriacs | 100.0 /100 | #5 | Exceptional 17.0% |
| Filipinos | 100.0 /100 | #6 | Exceptional 17.0% |
| Thais | 100.0 /100 | #7 | Exceptional 17.3% |
| Immigrants | Iran | 100.0 /100 | #8 | Exceptional 17.5% |
| Bhutanese | 100.0 /100 | #9 | Exceptional 17.7% |
| Immigrants | Ireland | 100.0 /100 | #10 | Exceptional 17.8% |
| Immigrants | Lithuania | 100.0 /100 | #11 | Exceptional 17.8% |
| Immigrants | South Central Asia | 100.0 /100 | #12 | Exceptional 17.8% |
| Immigrants | Bolivia | 100.0 /100 | #13 | Exceptional 17.8% |
| Bolivians | 100.0 /100 | #14 | Exceptional 17.9% |
| Indians (Asian) | 100.0 /100 | #15 | Exceptional 17.9% |