Immigrants from Kazakhstan vs Australian Male Poverty
COMPARE
Immigrants from Kazakhstan
Australian
Male Poverty
Male Poverty Comparison
Immigrants from Kazakhstan
Australians
11.0%
MALE POVERTY
64.8/ 100
METRIC RATING
154th/ 347
METRIC RANK
10.4%
MALE POVERTY
94.4/ 100
METRIC RATING
93rd/ 347
METRIC RANK
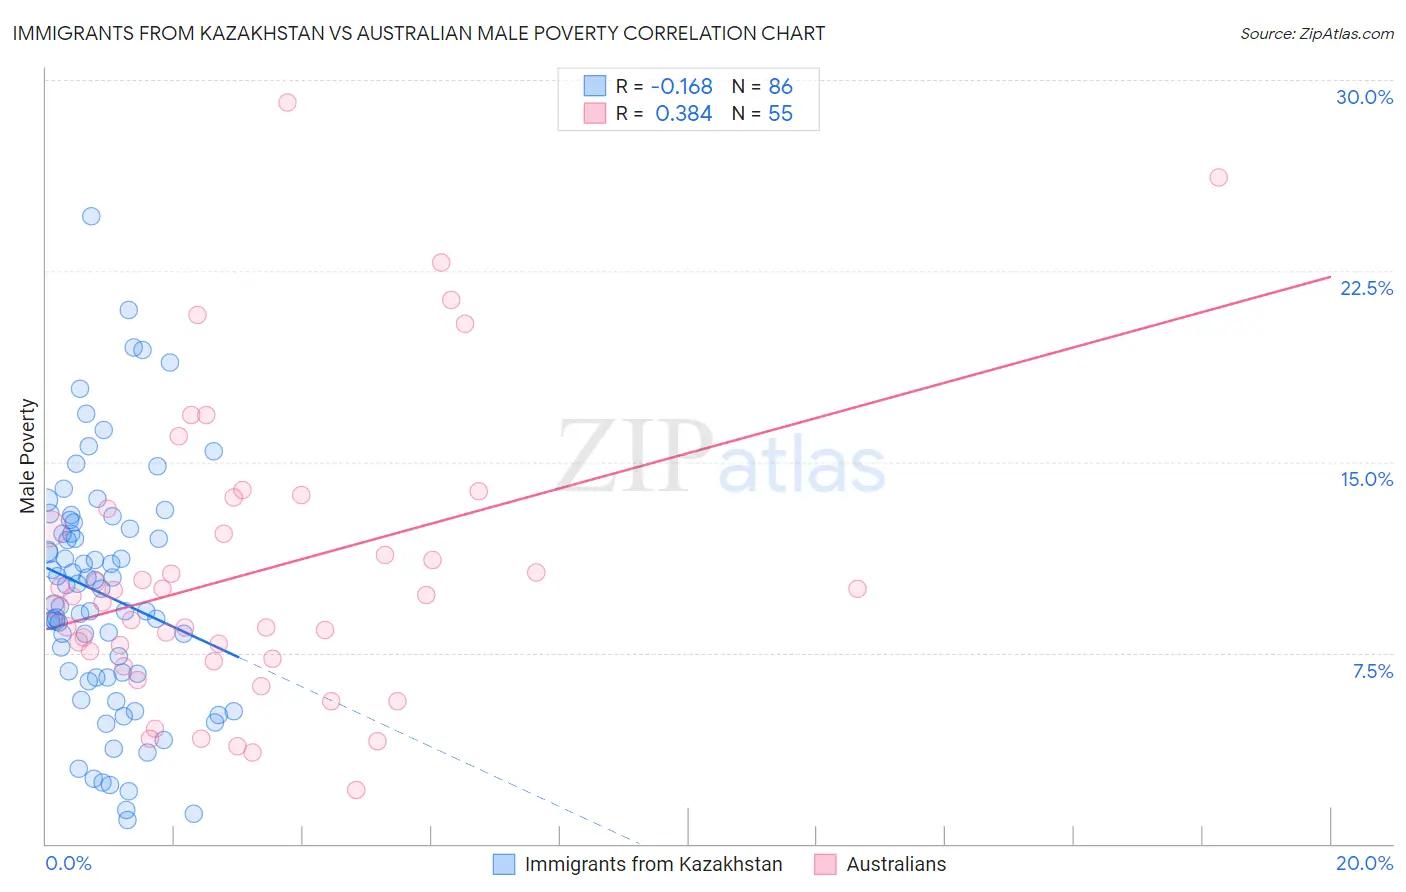
Immigrants from Kazakhstan vs Australian Male Poverty Correlation Chart
The statistical analysis conducted on geographies consisting of 124,423,008 people shows a poor negative correlation between the proportion of Immigrants from Kazakhstan and poverty level among males in the United States with a correlation coefficient (R) of -0.168 and weighted average of 11.0%. Similarly, the statistical analysis conducted on geographies consisting of 223,991,142 people shows a mild positive correlation between the proportion of Australians and poverty level among males in the United States with a correlation coefficient (R) of 0.384 and weighted average of 10.4%, a difference of 5.8%.
Male Poverty Correlation Summary
| Measurement | Immigrants from Kazakhstan | Australian |
| Minimum | 0.92% | 2.1% |
| Maximum | 24.6% | 29.1% |
| Range | 23.7% | 27.0% |
| Mean | 9.8% | 10.7% |
| Median | 9.7% | 9.7% |
| Interquartile 25% (IQ1) | 6.5% | 7.3% |
| Interquartile 75% (IQ3) | 12.4% | 13.1% |
| Interquartile Range (IQR) | 5.9% | 5.9% |
| Standard Deviation (Sample) | 4.7% | 5.7% |
| Standard Deviation (Population) | 4.7% | 5.6% |
Similar Demographics by Male Poverty
Demographics Similar to Immigrants from Kazakhstan by Male Poverty
In terms of male poverty, the demographic groups most similar to Immigrants from Kazakhstan are Immigrants from Malaysia (11.0%, a difference of 0.010%), Immigrants from Bosnia and Herzegovina (11.0%, a difference of 0.050%), Costa Rican (11.0%, a difference of 0.10%), Scotch-Irish (11.0%, a difference of 0.12%), and Colombian (11.0%, a difference of 0.20%).
| Demographics | Rating | Rank | Male Poverty |
| Icelanders | 68.5 /100 | #147 | Good 11.0% |
| Armenians | 68.0 /100 | #148 | Good 11.0% |
| Immigrants | Venezuela | 67.9 /100 | #149 | Good 11.0% |
| Guamanians/Chamorros | 67.6 /100 | #150 | Good 11.0% |
| Venezuelans | 67.4 /100 | #151 | Good 11.0% |
| Immigrants | Nepal | 67.3 /100 | #152 | Good 11.0% |
| Immigrants | Bosnia and Herzegovina | 65.2 /100 | #153 | Good 11.0% |
| Immigrants | Kazakhstan | 64.8 /100 | #154 | Good 11.0% |
| Immigrants | Malaysia | 64.7 /100 | #155 | Good 11.0% |
| Costa Ricans | 63.9 /100 | #156 | Good 11.0% |
| Scotch-Irish | 63.7 /100 | #157 | Good 11.0% |
| Colombians | 63.0 /100 | #158 | Good 11.0% |
| Taiwanese | 62.7 /100 | #159 | Good 11.0% |
| Soviet Union | 60.3 /100 | #160 | Good 11.1% |
| Immigrants | Northern Africa | 59.7 /100 | #161 | Average 11.1% |
Demographics Similar to Australians by Male Poverty
In terms of male poverty, the demographic groups most similar to Australians are Jordanian (10.4%, a difference of 0.0%), Immigrants from South Africa (10.4%, a difference of 0.17%), British (10.4%, a difference of 0.20%), Scottish (10.4%, a difference of 0.20%), and Indian (Asian) (10.4%, a difference of 0.27%).
| Demographics | Rating | Rank | Male Poverty |
| Immigrants | Eastern Asia | 95.3 /100 | #86 | Exceptional 10.4% |
| Northern Europeans | 95.2 /100 | #87 | Exceptional 10.4% |
| Cambodians | 95.0 /100 | #88 | Exceptional 10.4% |
| Immigrants | Denmark | 95.0 /100 | #89 | Exceptional 10.4% |
| Indians (Asian) | 94.9 /100 | #90 | Exceptional 10.4% |
| British | 94.8 /100 | #91 | Exceptional 10.4% |
| Jordanians | 94.4 /100 | #92 | Exceptional 10.4% |
| Australians | 94.4 /100 | #93 | Exceptional 10.4% |
| Immigrants | South Africa | 94.1 /100 | #94 | Exceptional 10.4% |
| Scottish | 94.0 /100 | #95 | Exceptional 10.4% |
| Immigrants | Egypt | 93.7 /100 | #96 | Exceptional 10.4% |
| Romanians | 93.6 /100 | #97 | Exceptional 10.5% |
| Finns | 93.4 /100 | #98 | Exceptional 10.5% |
| Immigrants | Indonesia | 93.3 /100 | #99 | Exceptional 10.5% |
| Immigrants | Latvia | 92.8 /100 | #100 | Exceptional 10.5% |