Immigrants from Kazakhstan vs Hungarian Family Poverty
COMPARE
Immigrants from Kazakhstan
Hungarian
Family Poverty
Family Poverty Comparison
Immigrants from Kazakhstan
Hungarians
8.5%
FAMILY POVERTY
84.1/ 100
METRIC RATING
140th/ 347
METRIC RANK
8.8%
FAMILY POVERTY
67.2/ 100
METRIC RATING
160th/ 347
METRIC RANK
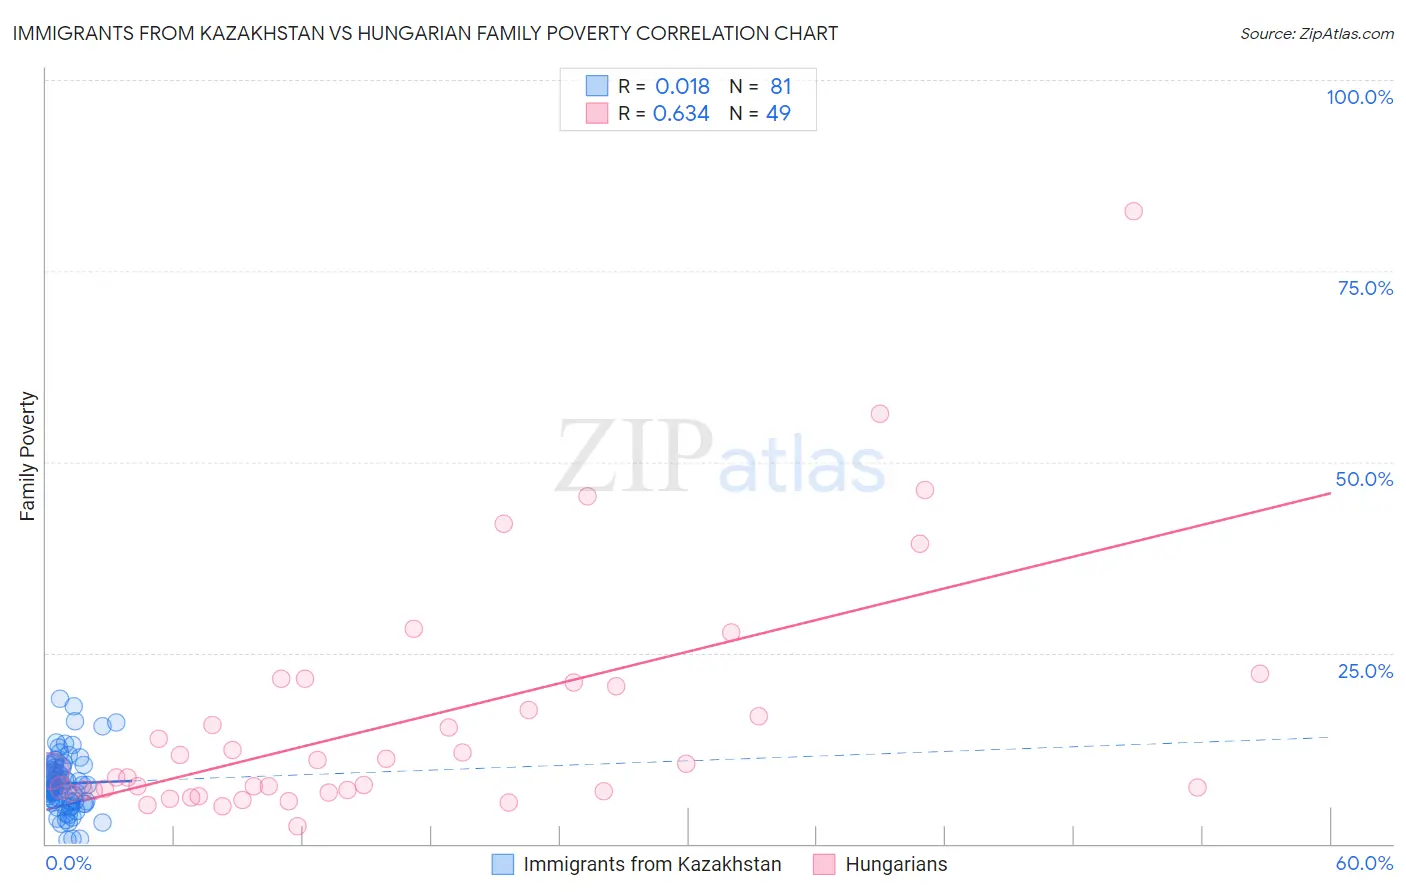
Immigrants from Kazakhstan vs Hungarian Family Poverty Correlation Chart
The statistical analysis conducted on geographies consisting of 124,352,430 people shows no correlation between the proportion of Immigrants from Kazakhstan and poverty level among families in the United States with a correlation coefficient (R) of 0.018 and weighted average of 8.5%. Similarly, the statistical analysis conducted on geographies consisting of 483,762,053 people shows a significant positive correlation between the proportion of Hungarians and poverty level among families in the United States with a correlation coefficient (R) of 0.634 and weighted average of 8.8%, a difference of 3.3%.
Family Poverty Correlation Summary
| Measurement | Immigrants from Kazakhstan | Hungarian |
| Minimum | 0.57% | 2.4% |
| Maximum | 19.0% | 82.8% |
| Range | 18.4% | 80.4% |
| Mean | 7.9% | 16.1% |
| Median | 7.6% | 9.5% |
| Interquartile 25% (IQ1) | 5.5% | 6.9% |
| Interquartile 75% (IQ3) | 10.1% | 20.9% |
| Interquartile Range (IQR) | 4.6% | 13.9% |
| Standard Deviation (Sample) | 3.7% | 15.7% |
| Standard Deviation (Population) | 3.7% | 15.6% |
Demographics Similar to Immigrants from Kazakhstan and Hungarians by Family Poverty
In terms of family poverty, the demographic groups most similar to Immigrants from Kazakhstan are Immigrants from Ukraine (8.5%, a difference of 0.030%), Yugoslavian (8.5%, a difference of 0.15%), Immigrants from Germany (8.5%, a difference of 0.18%), Albanian (8.5%, a difference of 0.20%), and Immigrants from South Eastern Asia (8.5%, a difference of 0.22%). Similarly, the demographic groups most similar to Hungarians are Peruvian (8.8%, a difference of 0.13%), White/Caucasian (8.8%, a difference of 0.30%), Tsimshian (8.8%, a difference of 0.34%), Immigrants from Oceania (8.7%, a difference of 0.64%), and Immigrants from Kuwait (8.7%, a difference of 1.0%).
| Demographics | Rating | Rank | Family Poverty |
| Immigrants | Kazakhstan | 84.1 /100 | #140 | Excellent 8.5% |
| Immigrants | Ukraine | 83.9 /100 | #141 | Excellent 8.5% |
| Yugoslavians | 83.5 /100 | #142 | Excellent 8.5% |
| Immigrants | Germany | 83.3 /100 | #143 | Excellent 8.5% |
| Albanians | 83.3 /100 | #144 | Excellent 8.5% |
| Immigrants | South Eastern Asia | 83.2 /100 | #145 | Excellent 8.5% |
| Immigrants | Belarus | 83.2 /100 | #146 | Excellent 8.5% |
| Immigrants | Jordan | 83.0 /100 | #147 | Excellent 8.5% |
| Scotch-Irish | 82.2 /100 | #148 | Excellent 8.6% |
| Mongolians | 80.4 /100 | #149 | Excellent 8.6% |
| Syrians | 80.3 /100 | #150 | Excellent 8.6% |
| Brazilians | 80.1 /100 | #151 | Excellent 8.6% |
| Samoans | 79.8 /100 | #152 | Good 8.6% |
| Immigrants | Spain | 79.1 /100 | #153 | Good 8.6% |
| Immigrants | Vietnam | 75.4 /100 | #154 | Good 8.7% |
| Immigrants | Kuwait | 73.6 /100 | #155 | Good 8.7% |
| Immigrants | Oceania | 71.2 /100 | #156 | Good 8.7% |
| Tsimshian | 69.3 /100 | #157 | Good 8.8% |
| Whites/Caucasians | 69.1 /100 | #158 | Good 8.8% |
| Peruvians | 68.0 /100 | #159 | Good 8.8% |
| Hungarians | 67.2 /100 | #160 | Good 8.8% |