Immigrants from Kazakhstan vs Immigrants from Morocco Family Poverty

COMPARE

Immigrants from Kazakhstan
Race
Ancestry
AfghanAfricanAlaska NativeAlaskan AthabascanAlbanianAleutAlsatianAmericanApacheArabArapahoArgentineanArmenianAssyrian/Chaldean/SyriacAustralianAustrianBahamianBangladeshiBarbadianBasqueBelgianBelizeanBermudanBhutaneseBlackfeetBolivianBrazilianBritishBritish West IndianBulgarianBurmeseCajunCambodianCanadianCape VerdeanCarpatho RusynCelticCentral AmericanCentral American IndianCherokeeCheyenneChickasawChileanChineseChippewaChoctawColombianColvilleComancheCosta RicanCreeCreekCroatianCrowCubanCypriotCzechCzechoslovakianDanishDelawareDominicanDutchDutch West IndianEastern EuropeanEcuadorianEgyptianEnglishEstonianEthiopianEuropeanFijianFilipinoFinnishFrenchFrench American IndianFrench CanadianGermanGerman RussianGhanaianGreekGuamanian/ChamorroGuatemalanGuyaneseHaitianHmongHonduranHopiHoumaHungarianIcelanderIndian (Asian)IndonesianInupiatIranianIraqiIrishIroquoisIsraeliItalianJamaicanJapaneseJordanianKenyanKiowaKoreanLaotianLatvianLebaneseLiberianLithuanianLumbeeLuxembourgerMacedonianMalaysianMalteseMarshalleseMenomineeMexicanMexican American IndianMongolianMoroccanNative HawaiianNavajoNepaleseNew ZealanderNicaraguanNigerianNorthern EuropeanNorwegianOkinawanOsageOttawaPaiutePakistaniPalestinianPanamanianParaguayanPennsylvania GermanPeruvianPimaPolishPortuguesePotawatomiPuebloPuerto RicanPuget Sound SalishRomanianRussianSalvadoranSamoanScandinavianScotch-IrishScottishSeminoleSenegaleseSerbianShoshoneSierra LeoneanSiouxSlavicSlovakSloveneSomaliSouth AfricanSouth AmericanSouth American IndianSoviet UnionSpaniardSpanishSpanish AmericanSpanish American IndianSri LankanSubsaharan AfricanSudaneseSwedishSwissSyrianTaiwaneseThaiTlingit-HaidaTohono O'OdhamTonganTrinidadian and TobagonianTsimshianTurkishU.S. Virgin IslanderUgandanUkrainianUruguayanUteVenezuelanVietnameseWelshWest IndianYakamaYaquiYugoslavianYumanYup'ikZimbabwean
Immigration
NonimmigrantsImmigrantsAfghanistanAfricaAlbaniaArgentinaArmeniaAsiaAustraliaAustriaBahamasBangladeshBarbadosBelarusBelgiumBelizeBoliviaBosnia and HerzegovinaBrazilBulgariaBurma/MyanmarCabo VerdeCambodiaCameroonCanadaCaribbeanCentral AmericaChileChinaColombiaCongoCosta RicaCroatiaCubaCzechoslovakiaDenmarkDominicaDominican RepublicEastern AfricaEastern AsiaEastern EuropeEcuadorEgyptEl SalvadorEnglandEritreaEthiopiaEuropeFijiFranceGermanyGhanaGreeceGrenadaGuatemalaGuyanaHaitiHondurasHong KongHungaryIndiaIndonesiaIranIraqIrelandIsraelItalyJamaicaJapanJordanKazakhstanKenyaKoreaKuwaitLaosLatin AmericaLatviaLebanonLiberiaLithuaniaMalaysiaMexicoMicronesiaMiddle AfricaMoldovaNepalNetherlandsNicaraguaNigeriaNorth AmericaNorth MacedoniaNorthern AfricaNorthern EuropeNorwayOceaniaPakistanPanamaPeruPhilippinesPolandPortugalRomaniaRussiaSaudi ArabiaScotlandSenegalSerbiaSierra LeoneSingaporeSomaliaSouth AfricaSouth AmericaSouth Central AsiaSouth Eastern AsiaSouthern EuropeSpainSri LankaSt. Vincent and the GrenadinesSudanSwedenSwitzerlandSyriaTaiwanThailandTrinidad and TobagoTurkeyUgandaUkraineUruguayUzbekistanVenezuelaVietnamWest IndiesWestern AfricaWestern AsiaWestern EuropeYemenZaireZimbabweAzores
Immigrants from Morocco
Race
Ancestry
AfghanAfricanAlaska NativeAlaskan AthabascanAlbanianAleutAlsatianAmericanApacheArabArapahoArgentineanArmenianAssyrian/Chaldean/SyriacAustralianAustrianBahamianBangladeshiBarbadianBasqueBelgianBelizeanBermudanBhutaneseBlackfeetBolivianBrazilianBritishBritish West IndianBulgarianBurmeseCajunCambodianCanadianCape VerdeanCarpatho RusynCelticCentral AmericanCentral American IndianCherokeeCheyenneChickasawChileanChineseChippewaChoctawColombianColvilleComancheCosta RicanCreeCreekCroatianCrowCubanCypriotCzechCzechoslovakianDanishDelawareDominicanDutchDutch West IndianEastern EuropeanEcuadorianEgyptianEnglishEstonianEthiopianEuropeanFijianFilipinoFinnishFrenchFrench American IndianFrench CanadianGermanGerman RussianGhanaianGreekGuamanian/ChamorroGuatemalanGuyaneseHaitianHmongHonduranHopiHoumaHungarianIcelanderIndian (Asian)IndonesianInupiatIranianIraqiIrishIroquoisIsraeliItalianJamaicanJapaneseJordanianKenyanKiowaKoreanLaotianLatvianLebaneseLiberianLithuanianLumbeeLuxembourgerMacedonianMalaysianMalteseMarshalleseMenomineeMexicanMexican American IndianMongolianMoroccanNative HawaiianNavajoNepaleseNew ZealanderNicaraguanNigerianNorthern EuropeanNorwegianOkinawanOsageOttawaPaiutePakistaniPalestinianPanamanianParaguayanPennsylvania GermanPeruvianPimaPolishPortuguesePotawatomiPuebloPuerto RicanPuget Sound SalishRomanianRussianSalvadoranSamoanScandinavianScotch-IrishScottishSeminoleSenegaleseSerbianShoshoneSierra LeoneanSiouxSlavicSlovakSloveneSomaliSouth AfricanSouth AmericanSouth American IndianSoviet UnionSpaniardSpanishSpanish AmericanSpanish American IndianSri LankanSubsaharan AfricanSudaneseSwedishSwissSyrianTaiwaneseThaiTlingit-HaidaTohono O'OdhamTonganTrinidadian and TobagonianTsimshianTurkishU.S. Virgin IslanderUgandanUkrainianUruguayanUteVenezuelanVietnameseWelshWest IndianYakamaYaquiYugoslavianYumanYup'ikZimbabwean
Immigration
NonimmigrantsImmigrantsAfghanistanAfricaAlbaniaArgentinaArmeniaAsiaAustraliaAustriaBahamasBangladeshBarbadosBelarusBelgiumBelizeBoliviaBosnia and HerzegovinaBrazilBulgariaBurma/MyanmarCabo VerdeCambodiaCameroonCanadaCaribbeanCentral AmericaChileChinaColombiaCongoCosta RicaCroatiaCubaCzechoslovakiaDenmarkDominicaDominican RepublicEastern AfricaEastern AsiaEastern EuropeEcuadorEgyptEl SalvadorEnglandEritreaEthiopiaEuropeFijiFranceGermanyGhanaGreeceGrenadaGuatemalaGuyanaHaitiHondurasHong KongHungaryIndiaIndonesiaIranIraqIrelandIsraelItalyJamaicaJapanJordanKenyaKoreaKuwaitLaosLatin AmericaLatviaLebanonLiberiaLithuaniaMalaysiaMexicoMicronesiaMiddle AfricaMoldovaMoroccoNepalNetherlandsNicaraguaNigeriaNorth AmericaNorth MacedoniaNorthern AfricaNorthern EuropeNorwayOceaniaPakistanPanamaPeruPhilippinesPolandPortugalRomaniaRussiaSaudi ArabiaScotlandSenegalSerbiaSierra LeoneSingaporeSomaliaSouth AfricaSouth AmericaSouth Central AsiaSouth Eastern AsiaSouthern EuropeSpainSri LankaSt. Vincent and the GrenadinesSudanSwedenSwitzerlandSyriaTaiwanThailandTrinidad and TobagoTurkeyUgandaUkraineUruguayUzbekistanVenezuelaVietnamWest IndiesWestern AfricaWestern AsiaWestern EuropeYemenZaireZimbabweAzores
Family Poverty
Income
Poverty
Unemployment
Labor Participation
Family Structure
Vehicle Availability
Education Level
Disability

Family Poverty Comparison

Immigrants from Kazakhstan

Immigrants from Morocco

Excellent
Average
8.5%
FAMILY POVERTY
84.1/ 100
METRIC RATING
140th/ 347
METRIC RANK
9.1%
FAMILY POVERTY
40.2/ 100
METRIC RATING
182nd/ 347
METRIC RANK

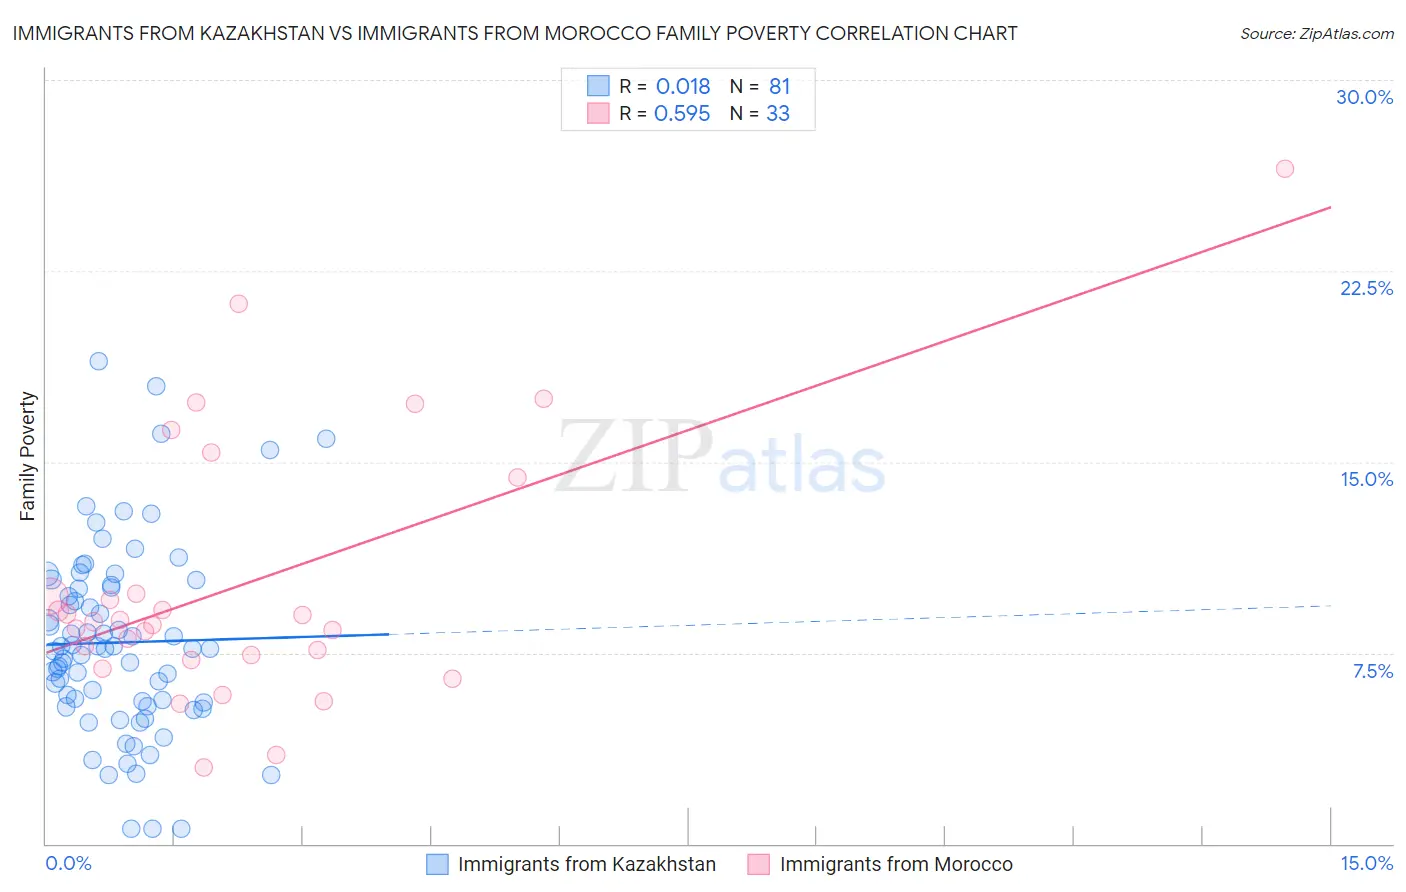
Immigrants from Kazakhstan vs Immigrants from Morocco Family Poverty Correlation Chart

The statistical analysis conducted on geographies consisting of 124,352,430 people shows no correlation between the proportion of Immigrants from Kazakhstan and poverty level among families in the United States with a correlation coefficient (R) of 0.018 and weighted average of 8.5%. Similarly, the statistical analysis conducted on geographies consisting of 178,782,527 people shows a substantial positive correlation between the proportion of Immigrants from Morocco and poverty level among families in the United States with a correlation coefficient (R) of 0.595 and weighted average of 9.1%, a difference of 7.1%.
Immigrants from Kazakhstan vs Immigrants from Morocco Family Poverty

Family Poverty Correlation Summary

MeasurementImmigrants from KazakhstanImmigrants from Morocco
Minimum0.57%3.0%
Maximum19.0%26.5%
Range18.4%23.5%
Mean7.9%10.2%
Median7.6%8.7%
Interquartile 25% (IQ1)5.5%7.3%
Interquartile 75% (IQ3)10.1%12.1%
Interquartile Range (IQR)4.6%4.8%
Standard Deviation (Sample)3.7%5.2%
Standard Deviation (Population)3.7%5.1%

Similar Demographics by Family Poverty

Demographics Similar to Immigrants from Kazakhstan by Family Poverty

In terms of family poverty, the demographic groups most similar to Immigrants from Kazakhstan are Immigrants from Nepal (8.5%, a difference of 0.030%), Immigrants from Ukraine (8.5%, a difference of 0.030%), Armenian (8.5%, a difference of 0.15%), Yugoslavian (8.5%, a difference of 0.15%), and Immigrants from Germany (8.5%, a difference of 0.18%).
DemographicsRating | RankFamily Poverty
Sri Lankans
86.6
/100
|
#133
Excellent
8.5%
Chileans
86.6
/100
|
#134
Excellent
8.5%
Immigrants | Malaysia
86.5
/100
|
#135
Excellent
8.5%
Immigrants | Brazil
86.3
/100
|
#136
Excellent
8.5%
Immigrants | Southern Europe
86.0
/100
|
#137
Excellent
8.5%
Armenians
84.6
/100
|
#138
Excellent
8.5%
Immigrants | Nepal
84.2
/100
|
#139
Excellent
8.5%
Immigrants | Kazakhstan
84.1
/100
|
#140
Excellent
8.5%
Immigrants | Ukraine
83.9
/100
|
#141
Excellent
8.5%
Yugoslavians
83.5
/100
|
#142
Excellent
8.5%
Immigrants | Germany
83.3
/100
|
#143
Excellent
8.5%
Albanians
83.3
/100
|
#144
Excellent
8.5%
Immigrants | South Eastern Asia
83.2
/100
|
#145
Excellent
8.5%
Immigrants | Belarus
83.2
/100
|
#146
Excellent
8.5%
Immigrants | Jordan
83.0
/100
|
#147
Excellent
8.5%

Demographics Similar to Immigrants from Morocco by Family Poverty

In terms of family poverty, the demographic groups most similar to Immigrants from Morocco are Hmong (9.1%, a difference of 0.010%), Uruguayan (9.1%, a difference of 0.13%), South American Indian (9.1%, a difference of 0.20%), Immigrants from Saudi Arabia (9.1%, a difference of 0.21%), and Immigrants from Uganda (9.1%, a difference of 0.43%).
DemographicsRating | RankFamily Poverty
Costa Ricans
49.3
/100
|
#175
Average
9.0%
Immigrants | Syria
47.5
/100
|
#176
Average
9.0%
Hawaiians
47.2
/100
|
#177
Average
9.0%
Immigrants | Cameroon
47.1
/100
|
#178
Average
9.0%
Immigrants | Iraq
44.4
/100
|
#179
Average
9.1%
Immigrants | Uganda
43.4
/100
|
#180
Average
9.1%
Hmong
40.2
/100
|
#181
Average
9.1%
Immigrants | Morocco
40.2
/100
|
#182
Average
9.1%
Uruguayans
39.2
/100
|
#183
Fair
9.1%
South American Indians
38.7
/100
|
#184
Fair
9.1%
Immigrants | Saudi Arabia
38.6
/100
|
#185
Fair
9.1%
Colombians
36.1
/100
|
#186
Fair
9.2%
Delaware
35.4
/100
|
#187
Fair
9.2%
Immigrants | Kenya
34.0
/100
|
#188
Fair
9.2%
Immigrants | Afghanistan
32.1
/100
|
#189
Fair
9.2%