Immigrants from Kazakhstan vs Immigrants from Latvia Family Poverty
COMPARE
Immigrants from Kazakhstan
Immigrants from Latvia
Family Poverty
Family Poverty Comparison
Immigrants from Kazakhstan
Immigrants from Latvia
8.5%
FAMILY POVERTY
84.1/ 100
METRIC RATING
140th/ 347
METRIC RANK
7.9%
FAMILY POVERTY
98.0/ 100
METRIC RATING
76th/ 347
METRIC RANK
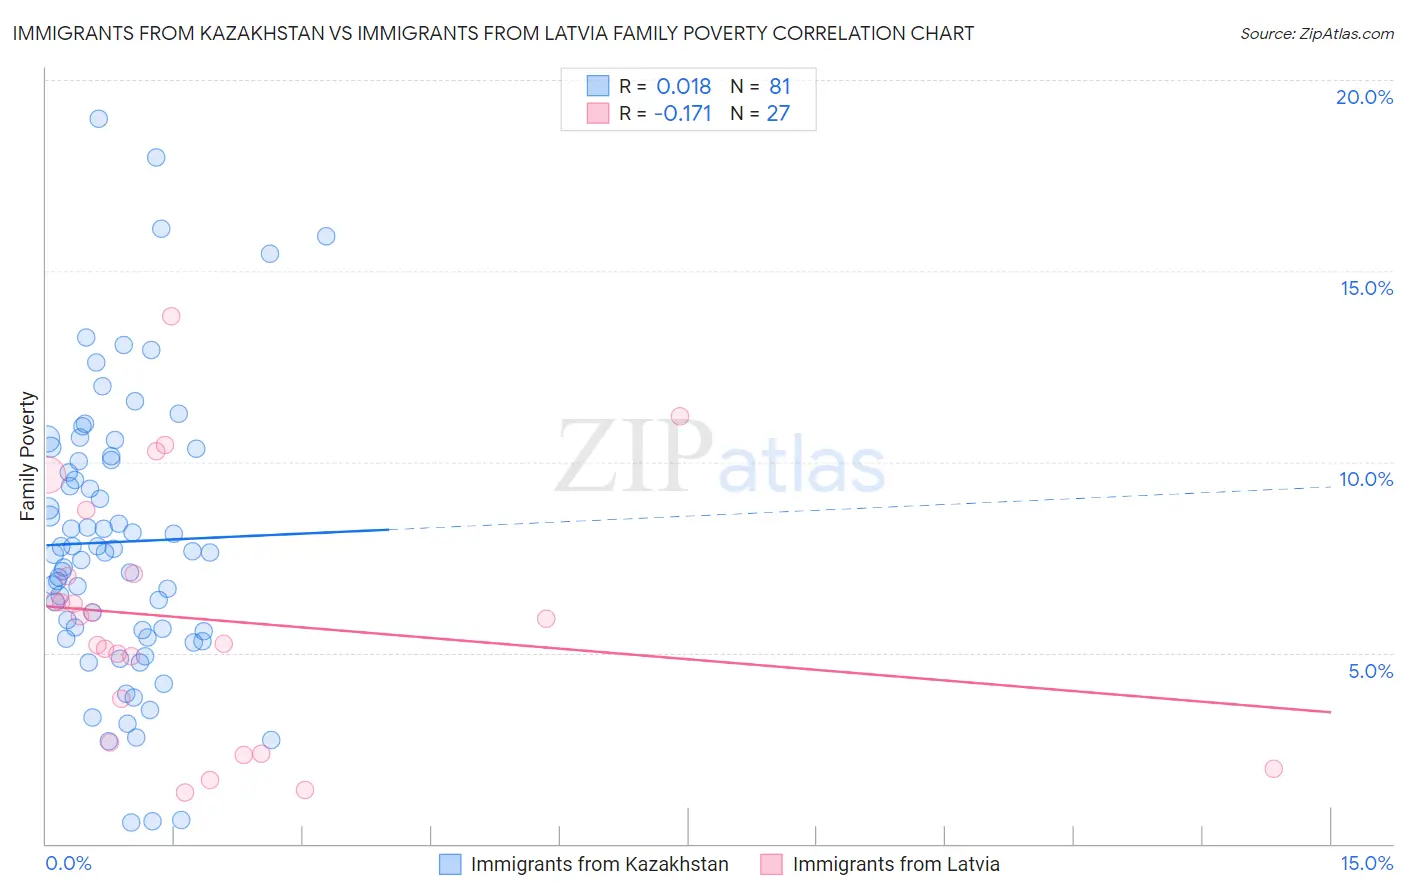
Immigrants from Kazakhstan vs Immigrants from Latvia Family Poverty Correlation Chart
The statistical analysis conducted on geographies consisting of 124,352,430 people shows no correlation between the proportion of Immigrants from Kazakhstan and poverty level among families in the United States with a correlation coefficient (R) of 0.018 and weighted average of 8.5%. Similarly, the statistical analysis conducted on geographies consisting of 113,662,762 people shows a poor negative correlation between the proportion of Immigrants from Latvia and poverty level among families in the United States with a correlation coefficient (R) of -0.171 and weighted average of 7.9%, a difference of 8.3%.
Family Poverty Correlation Summary
| Measurement | Immigrants from Kazakhstan | Immigrants from Latvia |
| Minimum | 0.57% | 1.4% |
| Maximum | 19.0% | 13.8% |
| Range | 18.4% | 12.5% |
| Mean | 7.9% | 5.9% |
| Median | 7.6% | 5.9% |
| Interquartile 25% (IQ1) | 5.5% | 2.7% |
| Interquartile 75% (IQ3) | 10.1% | 7.1% |
| Interquartile Range (IQR) | 4.6% | 4.4% |
| Standard Deviation (Sample) | 3.7% | 3.2% |
| Standard Deviation (Population) | 3.7% | 3.2% |
Similar Demographics by Family Poverty
Demographics Similar to Immigrants from Kazakhstan by Family Poverty
In terms of family poverty, the demographic groups most similar to Immigrants from Kazakhstan are Immigrants from Nepal (8.5%, a difference of 0.030%), Immigrants from Ukraine (8.5%, a difference of 0.030%), Armenian (8.5%, a difference of 0.15%), Yugoslavian (8.5%, a difference of 0.15%), and Immigrants from Germany (8.5%, a difference of 0.18%).
| Demographics | Rating | Rank | Family Poverty |
| Sri Lankans | 86.6 /100 | #133 | Excellent 8.5% |
| Chileans | 86.6 /100 | #134 | Excellent 8.5% |
| Immigrants | Malaysia | 86.5 /100 | #135 | Excellent 8.5% |
| Immigrants | Brazil | 86.3 /100 | #136 | Excellent 8.5% |
| Immigrants | Southern Europe | 86.0 /100 | #137 | Excellent 8.5% |
| Armenians | 84.6 /100 | #138 | Excellent 8.5% |
| Immigrants | Nepal | 84.2 /100 | #139 | Excellent 8.5% |
| Immigrants | Kazakhstan | 84.1 /100 | #140 | Excellent 8.5% |
| Immigrants | Ukraine | 83.9 /100 | #141 | Excellent 8.5% |
| Yugoslavians | 83.5 /100 | #142 | Excellent 8.5% |
| Immigrants | Germany | 83.3 /100 | #143 | Excellent 8.5% |
| Albanians | 83.3 /100 | #144 | Excellent 8.5% |
| Immigrants | South Eastern Asia | 83.2 /100 | #145 | Excellent 8.5% |
| Immigrants | Belarus | 83.2 /100 | #146 | Excellent 8.5% |
| Immigrants | Jordan | 83.0 /100 | #147 | Excellent 8.5% |
Demographics Similar to Immigrants from Latvia by Family Poverty
In terms of family poverty, the demographic groups most similar to Immigrants from Latvia are Ukrainian (7.9%, a difference of 0.010%), Immigrants from North America (7.9%, a difference of 0.12%), Immigrants from Europe (7.9%, a difference of 0.20%), Immigrants from Croatia (7.8%, a difference of 0.23%), and English (7.9%, a difference of 0.26%).
| Demographics | Rating | Rank | Family Poverty |
| Immigrants | Belgium | 98.2 /100 | #69 | Exceptional 7.8% |
| Immigrants | Canada | 98.2 /100 | #70 | Exceptional 7.8% |
| Cambodians | 98.2 /100 | #71 | Exceptional 7.8% |
| Immigrants | Romania | 98.2 /100 | #72 | Exceptional 7.8% |
| Austrians | 98.2 /100 | #73 | Exceptional 7.8% |
| Immigrants | China | 98.1 /100 | #74 | Exceptional 7.8% |
| Immigrants | Croatia | 98.1 /100 | #75 | Exceptional 7.8% |
| Immigrants | Latvia | 98.0 /100 | #76 | Exceptional 7.9% |
| Ukrainians | 98.0 /100 | #77 | Exceptional 7.9% |
| Immigrants | North America | 97.9 /100 | #78 | Exceptional 7.9% |
| Immigrants | Europe | 97.8 /100 | #79 | Exceptional 7.9% |
| English | 97.8 /100 | #80 | Exceptional 7.9% |
| Irish | 97.8 /100 | #81 | Exceptional 7.9% |
| Immigrants | Poland | 97.8 /100 | #82 | Exceptional 7.9% |
| Slovaks | 97.7 /100 | #83 | Exceptional 7.9% |