Immigrants from Kazakhstan vs Inupiat Family Poverty
COMPARE
Immigrants from Kazakhstan
Inupiat
Family Poverty
Family Poverty Comparison
Immigrants from Kazakhstan
Inupiat
8.5%
FAMILY POVERTY
84.1/ 100
METRIC RATING
140th/ 347
METRIC RANK
12.5%
FAMILY POVERTY
0.0/ 100
METRIC RATING
320th/ 347
METRIC RANK
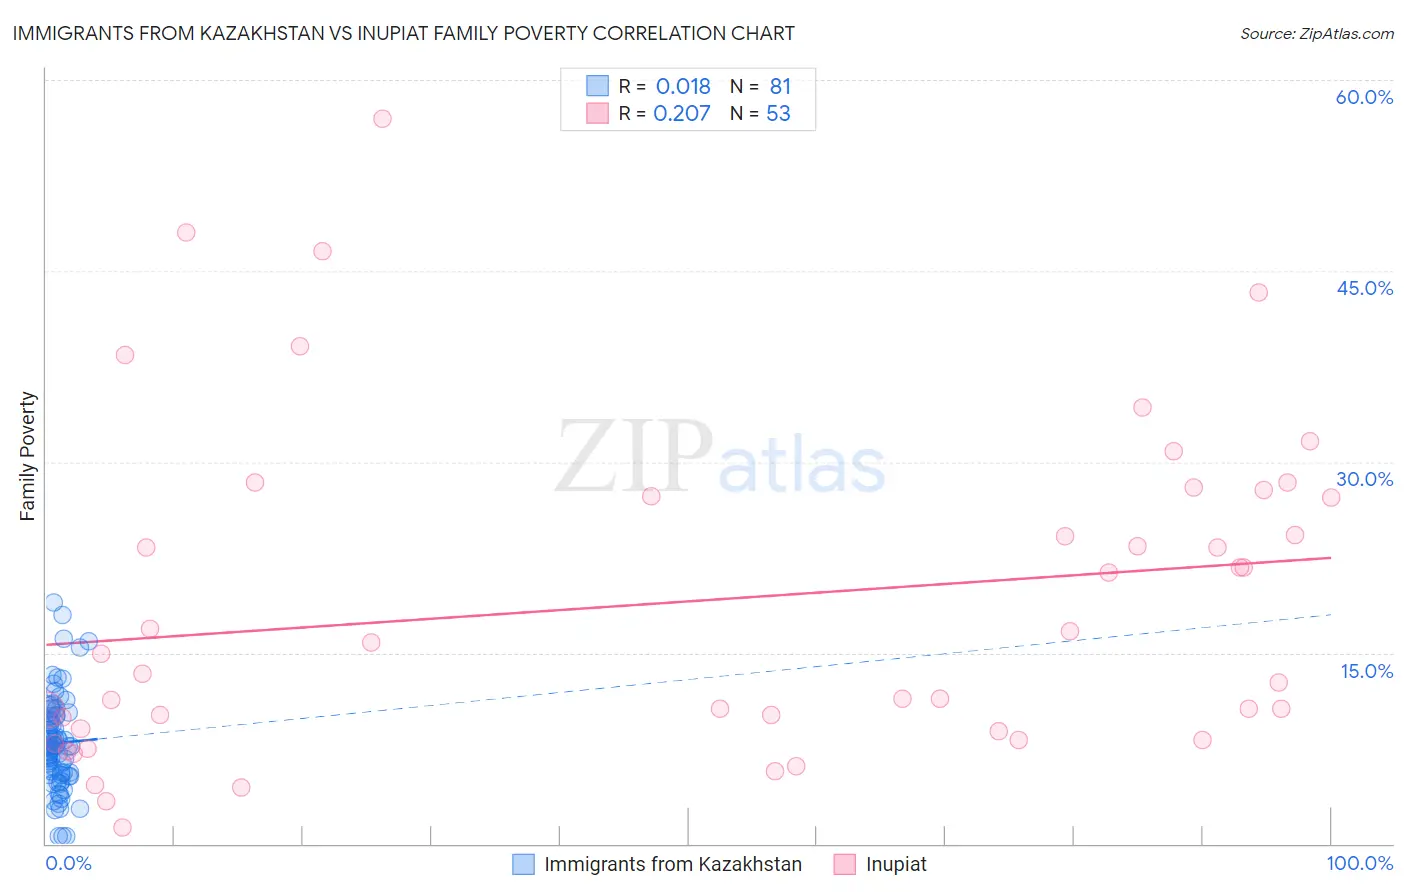
Immigrants from Kazakhstan vs Inupiat Family Poverty Correlation Chart
The statistical analysis conducted on geographies consisting of 124,352,430 people shows no correlation between the proportion of Immigrants from Kazakhstan and poverty level among families in the United States with a correlation coefficient (R) of 0.018 and weighted average of 8.5%. Similarly, the statistical analysis conducted on geographies consisting of 96,272,852 people shows a weak positive correlation between the proportion of Inupiat and poverty level among families in the United States with a correlation coefficient (R) of 0.207 and weighted average of 12.5%, a difference of 46.3%.
Family Poverty Correlation Summary
| Measurement | Immigrants from Kazakhstan | Inupiat |
| Minimum | 0.57% | 1.3% |
| Maximum | 19.0% | 56.9% |
| Range | 18.4% | 55.6% |
| Mean | 7.9% | 19.0% |
| Median | 7.6% | 14.9% |
| Interquartile 25% (IQ1) | 5.5% | 8.9% |
| Interquartile 75% (IQ3) | 10.1% | 27.5% |
| Interquartile Range (IQR) | 4.6% | 18.6% |
| Standard Deviation (Sample) | 3.7% | 12.9% |
| Standard Deviation (Population) | 3.7% | 12.8% |
Similar Demographics by Family Poverty
Demographics Similar to Immigrants from Kazakhstan by Family Poverty
In terms of family poverty, the demographic groups most similar to Immigrants from Kazakhstan are Immigrants from Nepal (8.5%, a difference of 0.030%), Immigrants from Ukraine (8.5%, a difference of 0.030%), Armenian (8.5%, a difference of 0.15%), Yugoslavian (8.5%, a difference of 0.15%), and Immigrants from Germany (8.5%, a difference of 0.18%).
| Demographics | Rating | Rank | Family Poverty |
| Sri Lankans | 86.6 /100 | #133 | Excellent 8.5% |
| Chileans | 86.6 /100 | #134 | Excellent 8.5% |
| Immigrants | Malaysia | 86.5 /100 | #135 | Excellent 8.5% |
| Immigrants | Brazil | 86.3 /100 | #136 | Excellent 8.5% |
| Immigrants | Southern Europe | 86.0 /100 | #137 | Excellent 8.5% |
| Armenians | 84.6 /100 | #138 | Excellent 8.5% |
| Immigrants | Nepal | 84.2 /100 | #139 | Excellent 8.5% |
| Immigrants | Kazakhstan | 84.1 /100 | #140 | Excellent 8.5% |
| Immigrants | Ukraine | 83.9 /100 | #141 | Excellent 8.5% |
| Yugoslavians | 83.5 /100 | #142 | Excellent 8.5% |
| Immigrants | Germany | 83.3 /100 | #143 | Excellent 8.5% |
| Albanians | 83.3 /100 | #144 | Excellent 8.5% |
| Immigrants | South Eastern Asia | 83.2 /100 | #145 | Excellent 8.5% |
| Immigrants | Belarus | 83.2 /100 | #146 | Excellent 8.5% |
| Immigrants | Jordan | 83.0 /100 | #147 | Excellent 8.5% |
Demographics Similar to Inupiat by Family Poverty
In terms of family poverty, the demographic groups most similar to Inupiat are British West Indian (12.4%, a difference of 0.48%), U.S. Virgin Islander (12.4%, a difference of 0.53%), Immigrants from Grenada (12.4%, a difference of 0.54%), Honduran (12.4%, a difference of 0.76%), and Immigrants from Mexico (12.3%, a difference of 1.5%).
| Demographics | Rating | Rank | Family Poverty |
| Immigrants | Caribbean | 0.0 /100 | #313 | Tragic 12.2% |
| Kiowa | 0.0 /100 | #314 | Tragic 12.2% |
| Immigrants | Mexico | 0.0 /100 | #315 | Tragic 12.3% |
| Hondurans | 0.0 /100 | #316 | Tragic 12.4% |
| Immigrants | Grenada | 0.0 /100 | #317 | Tragic 12.4% |
| U.S. Virgin Islanders | 0.0 /100 | #318 | Tragic 12.4% |
| British West Indians | 0.0 /100 | #319 | Tragic 12.4% |
| Inupiat | 0.0 /100 | #320 | Tragic 12.5% |
| Arapaho | 0.0 /100 | #321 | Tragic 12.7% |
| Immigrants | Honduras | 0.0 /100 | #322 | Tragic 12.7% |
| Menominee | 0.0 /100 | #323 | Tragic 12.7% |
| Immigrants | Dominica | 0.0 /100 | #324 | Tragic 12.7% |
| Paiute | 0.0 /100 | #325 | Tragic 13.0% |
| Colville | 0.0 /100 | #326 | Tragic 13.0% |
| Yakama | 0.0 /100 | #327 | Tragic 13.1% |