Korean vs Hungarian Family Poverty
COMPARE
Korean
Hungarian
Family Poverty
Family Poverty Comparison
Koreans
Hungarians
7.8%
FAMILY POVERTY
98.3/ 100
METRIC RATING
64th/ 347
METRIC RANK
8.8%
FAMILY POVERTY
67.2/ 100
METRIC RATING
160th/ 347
METRIC RANK
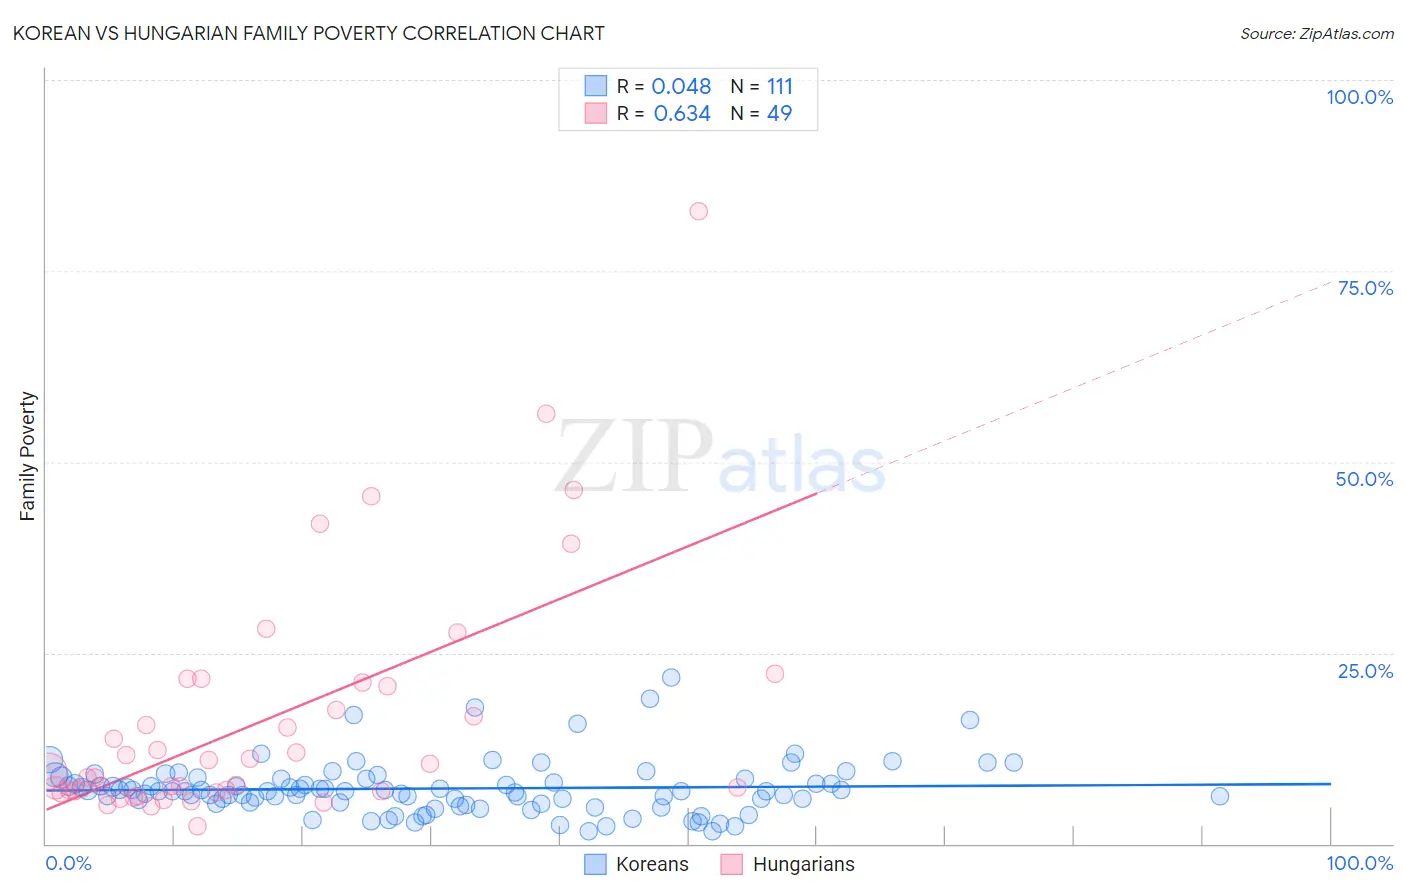
Korean vs Hungarian Family Poverty Correlation Chart
The statistical analysis conducted on geographies consisting of 508,576,179 people shows no correlation between the proportion of Koreans and poverty level among families in the United States with a correlation coefficient (R) of 0.048 and weighted average of 7.8%. Similarly, the statistical analysis conducted on geographies consisting of 483,762,053 people shows a significant positive correlation between the proportion of Hungarians and poverty level among families in the United States with a correlation coefficient (R) of 0.634 and weighted average of 8.8%, a difference of 12.6%.
Family Poverty Correlation Summary
| Measurement | Korean | Hungarian |
| Minimum | 1.6% | 2.4% |
| Maximum | 21.8% | 82.8% |
| Range | 20.2% | 80.4% |
| Mean | 7.2% | 16.1% |
| Median | 6.9% | 9.5% |
| Interquartile 25% (IQ1) | 5.4% | 6.9% |
| Interquartile 75% (IQ3) | 8.6% | 20.9% |
| Interquartile Range (IQR) | 3.2% | 13.9% |
| Standard Deviation (Sample) | 3.5% | 15.7% |
| Standard Deviation (Population) | 3.5% | 15.6% |
Similar Demographics by Family Poverty
Demographics Similar to Koreans by Family Poverty
In terms of family poverty, the demographic groups most similar to Koreans are Immigrants from Bulgaria (7.8%, a difference of 0.010%), Dutch (7.8%, a difference of 0.070%), Northern European (7.8%, a difference of 0.080%), Australian (7.8%, a difference of 0.12%), and Immigrants from Belgium (7.8%, a difference of 0.13%).
| Demographics | Rating | Rank | Family Poverty |
| Asians | 98.7 /100 | #57 | Exceptional 7.7% |
| Finns | 98.7 /100 | #58 | Exceptional 7.7% |
| Europeans | 98.7 /100 | #59 | Exceptional 7.7% |
| Immigrants | Greece | 98.7 /100 | #60 | Exceptional 7.7% |
| Immigrants | Netherlands | 98.6 /100 | #61 | Exceptional 7.7% |
| Macedonians | 98.6 /100 | #62 | Exceptional 7.8% |
| Zimbabweans | 98.4 /100 | #63 | Exceptional 7.8% |
| Koreans | 98.3 /100 | #64 | Exceptional 7.8% |
| Immigrants | Bulgaria | 98.3 /100 | #65 | Exceptional 7.8% |
| Dutch | 98.3 /100 | #66 | Exceptional 7.8% |
| Northern Europeans | 98.3 /100 | #67 | Exceptional 7.8% |
| Australians | 98.2 /100 | #68 | Exceptional 7.8% |
| Immigrants | Belgium | 98.2 /100 | #69 | Exceptional 7.8% |
| Immigrants | Canada | 98.2 /100 | #70 | Exceptional 7.8% |
| Cambodians | 98.2 /100 | #71 | Exceptional 7.8% |
Demographics Similar to Hungarians by Family Poverty
In terms of family poverty, the demographic groups most similar to Hungarians are Immigrants from Northern Africa (8.8%, a difference of 0.040%), Peruvian (8.8%, a difference of 0.13%), Ethiopian (8.8%, a difference of 0.13%), Pennsylvania German (8.8%, a difference of 0.18%), and White/Caucasian (8.8%, a difference of 0.30%).
| Demographics | Rating | Rank | Family Poverty |
| Immigrants | Spain | 79.1 /100 | #153 | Good 8.6% |
| Immigrants | Vietnam | 75.4 /100 | #154 | Good 8.7% |
| Immigrants | Kuwait | 73.6 /100 | #155 | Good 8.7% |
| Immigrants | Oceania | 71.2 /100 | #156 | Good 8.7% |
| Tsimshian | 69.3 /100 | #157 | Good 8.8% |
| Whites/Caucasians | 69.1 /100 | #158 | Good 8.8% |
| Peruvians | 68.0 /100 | #159 | Good 8.8% |
| Hungarians | 67.2 /100 | #160 | Good 8.8% |
| Immigrants | Northern Africa | 66.9 /100 | #161 | Good 8.8% |
| Ethiopians | 66.3 /100 | #162 | Good 8.8% |
| Pennsylvania Germans | 66.0 /100 | #163 | Good 8.8% |
| Celtics | 64.9 /100 | #164 | Good 8.8% |
| Guamanians/Chamorros | 64.7 /100 | #165 | Good 8.8% |
| Afghans | 63.5 /100 | #166 | Good 8.8% |
| Immigrants | Ethiopia | 62.5 /100 | #167 | Good 8.9% |