Trinidadian and Tobagonian vs Hungarian Family Poverty
COMPARE
Trinidadian and Tobagonian
Hungarian
Family Poverty
Family Poverty Comparison
Trinidadians and Tobagonians
Hungarians
10.9%
FAMILY POVERTY
0.1/ 100
METRIC RATING
264th/ 347
METRIC RANK
8.8%
FAMILY POVERTY
67.2/ 100
METRIC RATING
160th/ 347
METRIC RANK
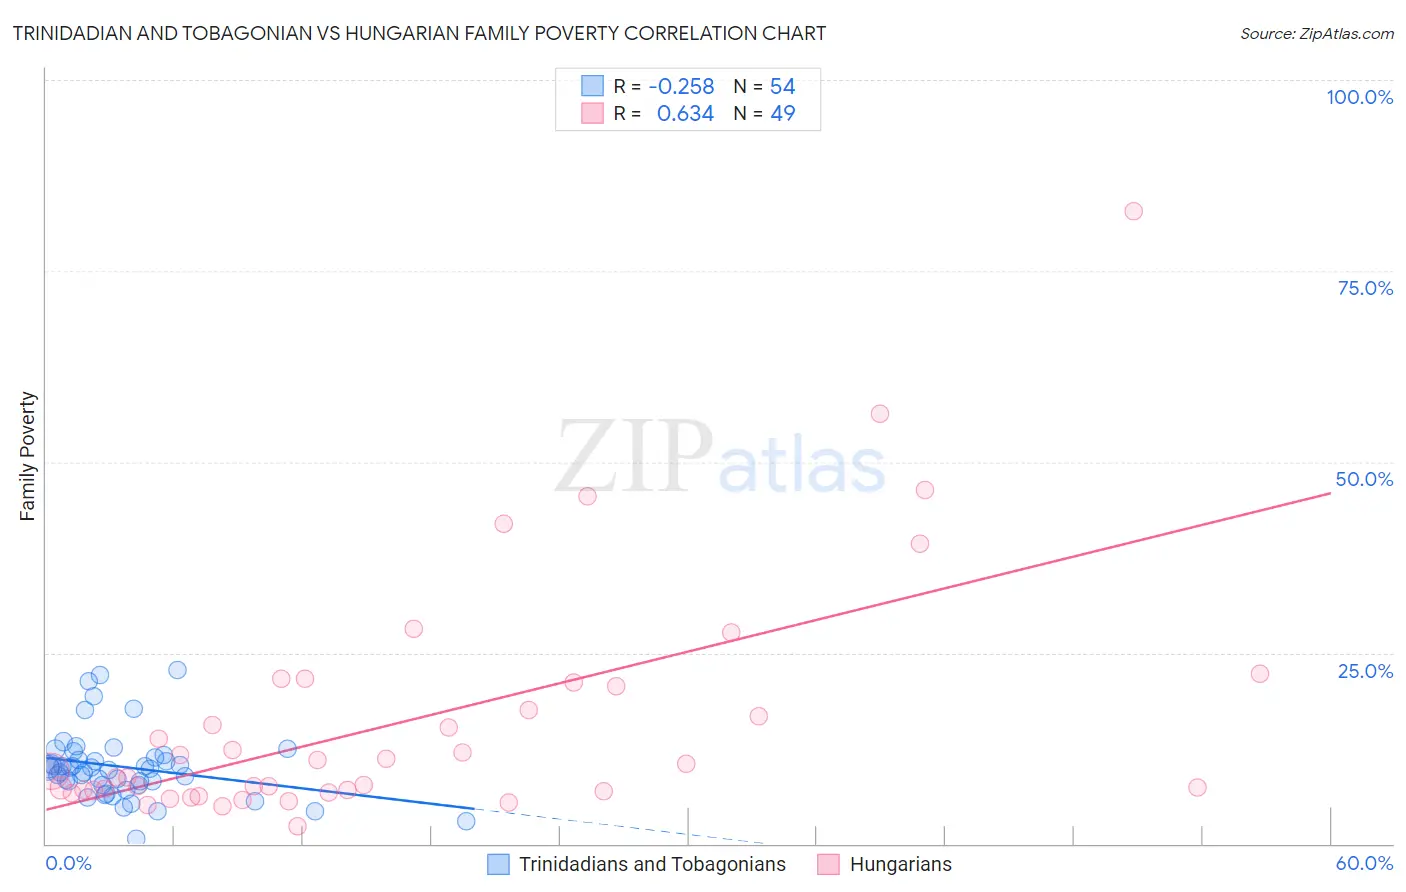
Trinidadian and Tobagonian vs Hungarian Family Poverty Correlation Chart
The statistical analysis conducted on geographies consisting of 219,444,154 people shows a weak negative correlation between the proportion of Trinidadians and Tobagonians and poverty level among families in the United States with a correlation coefficient (R) of -0.258 and weighted average of 10.9%. Similarly, the statistical analysis conducted on geographies consisting of 483,762,053 people shows a significant positive correlation between the proportion of Hungarians and poverty level among families in the United States with a correlation coefficient (R) of 0.634 and weighted average of 8.8%, a difference of 24.4%.
Family Poverty Correlation Summary
| Measurement | Trinidadian and Tobagonian | Hungarian |
| Minimum | 0.64% | 2.4% |
| Maximum | 22.8% | 82.8% |
| Range | 22.2% | 80.4% |
| Mean | 10.1% | 16.1% |
| Median | 9.9% | 9.5% |
| Interquartile 25% (IQ1) | 7.8% | 6.9% |
| Interquartile 75% (IQ3) | 11.2% | 20.9% |
| Interquartile Range (IQR) | 3.5% | 13.9% |
| Standard Deviation (Sample) | 4.5% | 15.7% |
| Standard Deviation (Population) | 4.4% | 15.6% |
Similar Demographics by Family Poverty
Demographics Similar to Trinidadians and Tobagonians by Family Poverty
In terms of family poverty, the demographic groups most similar to Trinidadians and Tobagonians are Cape Verdean (10.9%, a difference of 0.020%), Immigrants from Trinidad and Tobago (10.9%, a difference of 0.060%), Spanish American Indian (10.9%, a difference of 0.28%), Shoshone (10.9%, a difference of 0.41%), and Bangladeshi (10.9%, a difference of 0.44%).
| Demographics | Rating | Rank | Family Poverty |
| Immigrants | Ghana | 0.2 /100 | #257 | Tragic 10.8% |
| Sub-Saharan Africans | 0.2 /100 | #258 | Tragic 10.9% |
| Mexican American Indians | 0.2 /100 | #259 | Tragic 10.9% |
| Bangladeshis | 0.2 /100 | #260 | Tragic 10.9% |
| Shoshone | 0.2 /100 | #261 | Tragic 10.9% |
| Spanish American Indians | 0.2 /100 | #262 | Tragic 10.9% |
| Cape Verdeans | 0.1 /100 | #263 | Tragic 10.9% |
| Trinidadians and Tobagonians | 0.1 /100 | #264 | Tragic 10.9% |
| Immigrants | Trinidad and Tobago | 0.1 /100 | #265 | Tragic 10.9% |
| Immigrants | El Salvador | 0.1 /100 | #266 | Tragic 11.0% |
| Comanche | 0.1 /100 | #267 | Tragic 11.0% |
| Jamaicans | 0.1 /100 | #268 | Tragic 11.1% |
| Immigrants | Ecuador | 0.1 /100 | #269 | Tragic 11.1% |
| Immigrants | Nicaragua | 0.1 /100 | #270 | Tragic 11.1% |
| Immigrants | Bahamas | 0.1 /100 | #271 | Tragic 11.1% |
Demographics Similar to Hungarians by Family Poverty
In terms of family poverty, the demographic groups most similar to Hungarians are Immigrants from Northern Africa (8.8%, a difference of 0.040%), Peruvian (8.8%, a difference of 0.13%), Ethiopian (8.8%, a difference of 0.13%), Pennsylvania German (8.8%, a difference of 0.18%), and White/Caucasian (8.8%, a difference of 0.30%).
| Demographics | Rating | Rank | Family Poverty |
| Immigrants | Spain | 79.1 /100 | #153 | Good 8.6% |
| Immigrants | Vietnam | 75.4 /100 | #154 | Good 8.7% |
| Immigrants | Kuwait | 73.6 /100 | #155 | Good 8.7% |
| Immigrants | Oceania | 71.2 /100 | #156 | Good 8.7% |
| Tsimshian | 69.3 /100 | #157 | Good 8.8% |
| Whites/Caucasians | 69.1 /100 | #158 | Good 8.8% |
| Peruvians | 68.0 /100 | #159 | Good 8.8% |
| Hungarians | 67.2 /100 | #160 | Good 8.8% |
| Immigrants | Northern Africa | 66.9 /100 | #161 | Good 8.8% |
| Ethiopians | 66.3 /100 | #162 | Good 8.8% |
| Pennsylvania Germans | 66.0 /100 | #163 | Good 8.8% |
| Celtics | 64.9 /100 | #164 | Good 8.8% |
| Guamanians/Chamorros | 64.7 /100 | #165 | Good 8.8% |
| Afghans | 63.5 /100 | #166 | Good 8.8% |
| Immigrants | Ethiopia | 62.5 /100 | #167 | Good 8.9% |