Immigrants from Jordan vs Immigrants from Hong Kong 9th Grade
COMPARE
Immigrants from Jordan
Immigrants from Hong Kong
9th Grade
9th Grade Comparison
Immigrants from Jordan
Immigrants from Hong Kong
95.1%
9TH GRADE
81.2/ 100
METRIC RATING
148th/ 347
METRIC RANK
94.1%
9TH GRADE
1.3/ 100
METRIC RATING
250th/ 347
METRIC RANK
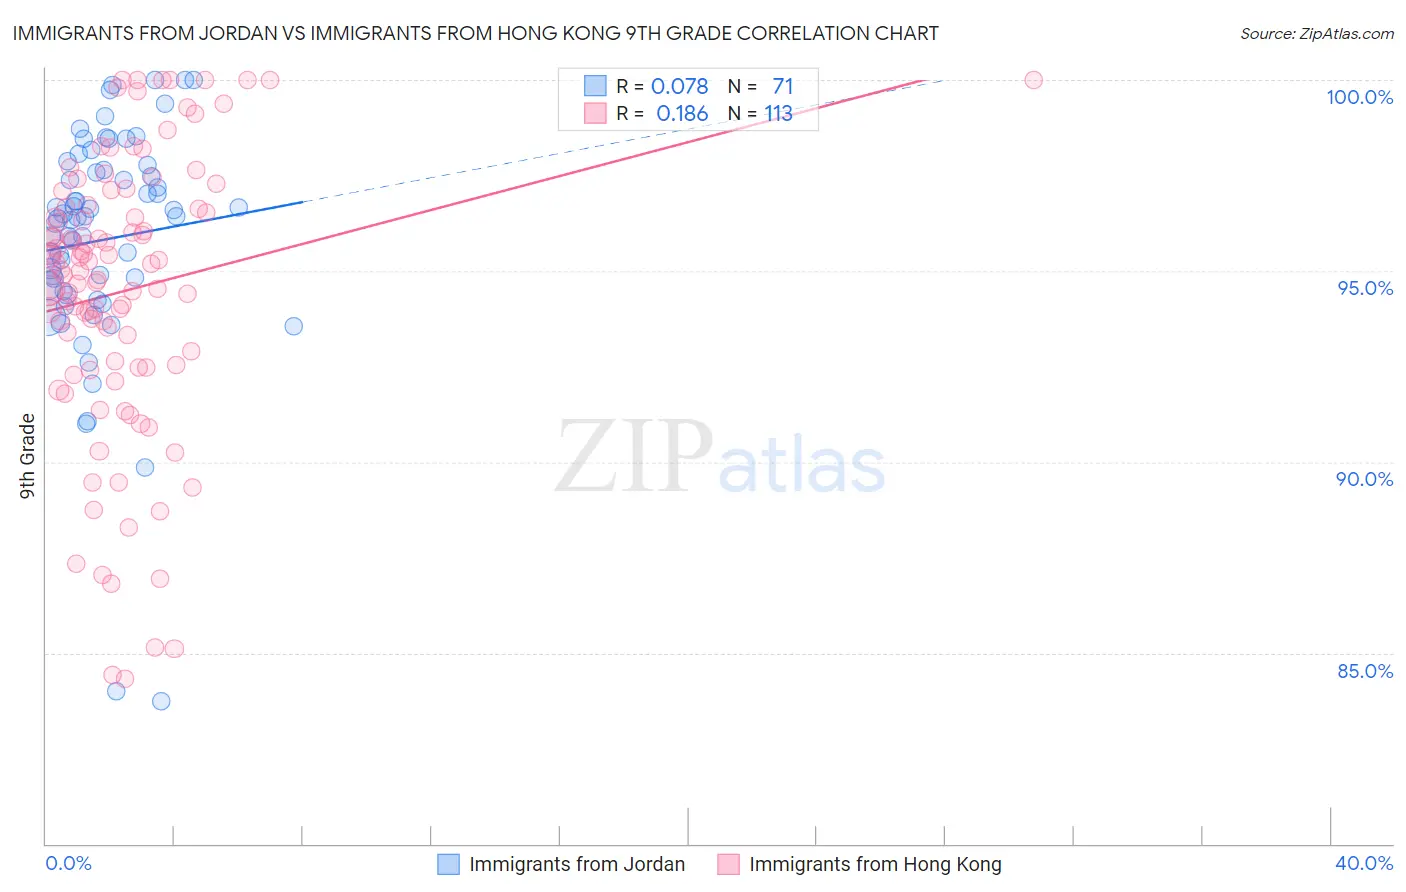
Immigrants from Jordan vs Immigrants from Hong Kong 9th Grade Correlation Chart
The statistical analysis conducted on geographies consisting of 181,278,272 people shows a slight positive correlation between the proportion of Immigrants from Jordan and percentage of population with at least 9th grade education in the United States with a correlation coefficient (R) of 0.078 and weighted average of 95.1%. Similarly, the statistical analysis conducted on geographies consisting of 253,990,382 people shows a poor positive correlation between the proportion of Immigrants from Hong Kong and percentage of population with at least 9th grade education in the United States with a correlation coefficient (R) of 0.186 and weighted average of 94.1%, a difference of 1.1%.
9th Grade Correlation Summary
| Measurement | Immigrants from Jordan | Immigrants from Hong Kong |
| Minimum | 83.7% | 84.3% |
| Maximum | 100.0% | 100.0% |
| Range | 16.3% | 15.7% |
| Mean | 95.8% | 94.5% |
| Median | 96.4% | 95.0% |
| Interquartile 25% (IQ1) | 94.5% | 92.5% |
| Interquartile 75% (IQ3) | 97.6% | 96.7% |
| Interquartile Range (IQR) | 3.2% | 4.2% |
| Standard Deviation (Sample) | 3.0% | 3.7% |
| Standard Deviation (Population) | 3.0% | 3.7% |
Similar Demographics by 9th Grade
Demographics Similar to Immigrants from Jordan by 9th Grade
In terms of 9th grade, the demographic groups most similar to Immigrants from Jordan are Pueblo (95.1%, a difference of 0.010%), Immigrants from Sri Lanka (95.1%, a difference of 0.010%), Choctaw (95.1%, a difference of 0.010%), Immigrants from Korea (95.1%, a difference of 0.020%), and Kenyan (95.1%, a difference of 0.020%).
| Demographics | Rating | Rank | 9th Grade |
| Immigrants | Bosnia and Herzegovina | 85.2 /100 | #141 | Excellent 95.2% |
| Immigrants | Greece | 84.6 /100 | #142 | Excellent 95.2% |
| Spanish | 84.4 /100 | #143 | Excellent 95.2% |
| Yup'ik | 83.3 /100 | #144 | Excellent 95.2% |
| Pueblo | 82.2 /100 | #145 | Excellent 95.1% |
| Immigrants | Sri Lanka | 82.1 /100 | #146 | Excellent 95.1% |
| Choctaw | 81.9 /100 | #147 | Excellent 95.1% |
| Immigrants | Jordan | 81.2 /100 | #148 | Excellent 95.1% |
| Immigrants | Korea | 79.6 /100 | #149 | Good 95.1% |
| Kenyans | 79.1 /100 | #150 | Good 95.1% |
| Cajuns | 77.3 /100 | #151 | Good 95.1% |
| Ugandans | 77.0 /100 | #152 | Good 95.1% |
| Albanians | 76.1 /100 | #153 | Good 95.1% |
| Arabs | 74.9 /100 | #154 | Good 95.1% |
| Immigrants | Kazakhstan | 74.7 /100 | #155 | Good 95.1% |
Demographics Similar to Immigrants from Hong Kong by 9th Grade
In terms of 9th grade, the demographic groups most similar to Immigrants from Hong Kong are Uruguayan (94.1%, a difference of 0.0%), Immigrants from Somalia (94.1%, a difference of 0.010%), Afghan (94.2%, a difference of 0.060%), Jamaican (94.1%, a difference of 0.060%), and Immigrants from Senegal (94.1%, a difference of 0.060%).
| Demographics | Rating | Rank | 9th Grade |
| Immigrants | Cameroon | 2.1 /100 | #243 | Tragic 94.2% |
| Dutch West Indians | 2.0 /100 | #244 | Tragic 94.2% |
| Paiute | 1.9 /100 | #245 | Tragic 94.2% |
| Senegalese | 1.9 /100 | #246 | Tragic 94.2% |
| Afghans | 1.8 /100 | #247 | Tragic 94.2% |
| Immigrants | Somalia | 1.4 /100 | #248 | Tragic 94.1% |
| Uruguayans | 1.3 /100 | #249 | Tragic 94.1% |
| Immigrants | Hong Kong | 1.3 /100 | #250 | Tragic 94.1% |
| Jamaicans | 1.0 /100 | #251 | Tragic 94.1% |
| Immigrants | Senegal | 0.9 /100 | #252 | Tragic 94.1% |
| Colombians | 0.8 /100 | #253 | Tragic 94.0% |
| U.S. Virgin Islanders | 0.7 /100 | #254 | Tragic 94.0% |
| Immigrants | Nigeria | 0.6 /100 | #255 | Tragic 94.0% |
| Immigrants | Afghanistan | 0.5 /100 | #256 | Tragic 94.0% |
| Immigrants | Costa Rica | 0.5 /100 | #257 | Tragic 94.0% |