Ecuadorian vs Immigrants from Hong Kong Male Poverty
COMPARE
Ecuadorian
Immigrants from Hong Kong
Male Poverty
Male Poverty Comparison
Ecuadorians
Immigrants from Hong Kong
12.7%
MALE POVERTY
0.4/ 100
METRIC RATING
238th/ 347
METRIC RANK
9.6%
MALE POVERTY
99.7/ 100
METRIC RATING
19th/ 347
METRIC RANK
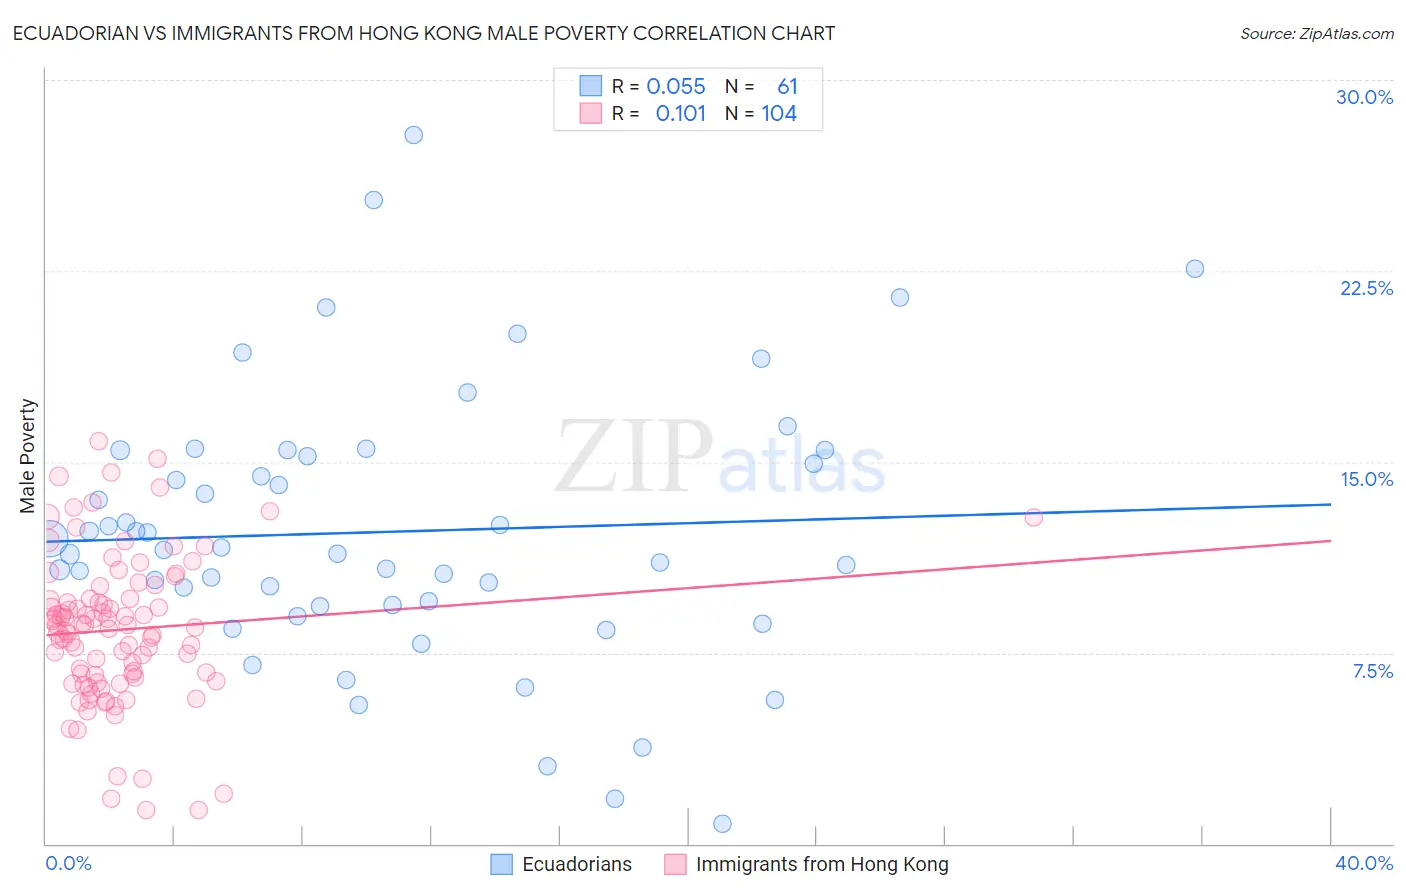
Ecuadorian vs Immigrants from Hong Kong Male Poverty Correlation Chart
The statistical analysis conducted on geographies consisting of 317,549,368 people shows a slight positive correlation between the proportion of Ecuadorians and poverty level among males in the United States with a correlation coefficient (R) of 0.055 and weighted average of 12.7%. Similarly, the statistical analysis conducted on geographies consisting of 253,850,467 people shows a poor positive correlation between the proportion of Immigrants from Hong Kong and poverty level among males in the United States with a correlation coefficient (R) of 0.101 and weighted average of 9.6%, a difference of 32.7%.
Male Poverty Correlation Summary
| Measurement | Ecuadorian | Immigrants from Hong Kong |
| Minimum | 0.81% | 1.3% |
| Maximum | 27.8% | 15.8% |
| Range | 27.0% | 14.5% |
| Mean | 12.3% | 8.4% |
| Median | 11.6% | 8.6% |
| Interquartile 25% (IQ1) | 9.4% | 6.6% |
| Interquartile 75% (IQ3) | 15.3% | 9.6% |
| Interquartile Range (IQR) | 6.0% | 3.0% |
| Standard Deviation (Sample) | 5.3% | 2.9% |
| Standard Deviation (Population) | 5.3% | 2.9% |
Similar Demographics by Male Poverty
Demographics Similar to Ecuadorians by Male Poverty
In terms of male poverty, the demographic groups most similar to Ecuadorians are Ghanaian (12.7%, a difference of 0.0%), French American Indian (12.7%, a difference of 0.030%), Immigrants from Saudi Arabia (12.7%, a difference of 0.080%), Immigrants from Middle Africa (12.7%, a difference of 0.28%), and Immigrants from Laos (12.6%, a difference of 0.32%).
| Demographics | Rating | Rank | Male Poverty |
| Salvadorans | 0.6 /100 | #231 | Tragic 12.6% |
| Nicaraguans | 0.6 /100 | #232 | Tragic 12.6% |
| Fijians | 0.6 /100 | #233 | Tragic 12.6% |
| Immigrants | Armenia | 0.6 /100 | #234 | Tragic 12.6% |
| Immigrants | Laos | 0.5 /100 | #235 | Tragic 12.6% |
| Immigrants | Saudi Arabia | 0.4 /100 | #236 | Tragic 12.7% |
| French American Indians | 0.4 /100 | #237 | Tragic 12.7% |
| Ecuadorians | 0.4 /100 | #238 | Tragic 12.7% |
| Ghanaians | 0.4 /100 | #239 | Tragic 12.7% |
| Immigrants | Middle Africa | 0.4 /100 | #240 | Tragic 12.7% |
| Sudanese | 0.3 /100 | #241 | Tragic 12.8% |
| Nepalese | 0.3 /100 | #242 | Tragic 12.8% |
| Alaskan Athabascans | 0.3 /100 | #243 | Tragic 12.8% |
| Tsimshian | 0.3 /100 | #244 | Tragic 12.8% |
| Liberians | 0.3 /100 | #245 | Tragic 12.8% |
Demographics Similar to Immigrants from Hong Kong by Male Poverty
In terms of male poverty, the demographic groups most similar to Immigrants from Hong Kong are Latvian (9.6%, a difference of 0.10%), Lithuanian (9.5%, a difference of 0.18%), Norwegian (9.5%, a difference of 0.35%), Immigrants from Scotland (9.6%, a difference of 0.36%), and Luxembourger (9.5%, a difference of 0.48%).
| Demographics | Rating | Rank | Male Poverty |
| Immigrants | Bolivia | 99.9 /100 | #12 | Exceptional 9.4% |
| Immigrants | Lithuania | 99.9 /100 | #13 | Exceptional 9.4% |
| Immigrants | North Macedonia | 99.8 /100 | #14 | Exceptional 9.4% |
| Bhutanese | 99.8 /100 | #15 | Exceptional 9.5% |
| Luxembourgers | 99.8 /100 | #16 | Exceptional 9.5% |
| Norwegians | 99.8 /100 | #17 | Exceptional 9.5% |
| Lithuanians | 99.8 /100 | #18 | Exceptional 9.5% |
| Immigrants | Hong Kong | 99.7 /100 | #19 | Exceptional 9.6% |
| Latvians | 99.7 /100 | #20 | Exceptional 9.6% |
| Immigrants | Scotland | 99.7 /100 | #21 | Exceptional 9.6% |
| Croatians | 99.7 /100 | #22 | Exceptional 9.6% |
| Italians | 99.7 /100 | #23 | Exceptional 9.6% |
| Swedes | 99.7 /100 | #24 | Exceptional 9.6% |
| Eastern Europeans | 99.6 /100 | #25 | Exceptional 9.6% |
| Burmese | 99.6 /100 | #26 | Exceptional 9.7% |