Russian vs Immigrants from Hong Kong Male Poverty
COMPARE
Russian
Immigrants from Hong Kong
Male Poverty
Male Poverty Comparison
Russians
Immigrants from Hong Kong
9.9%
MALE POVERTY
99.2/ 100
METRIC RATING
39th/ 347
METRIC RANK
9.6%
MALE POVERTY
99.7/ 100
METRIC RATING
19th/ 347
METRIC RANK
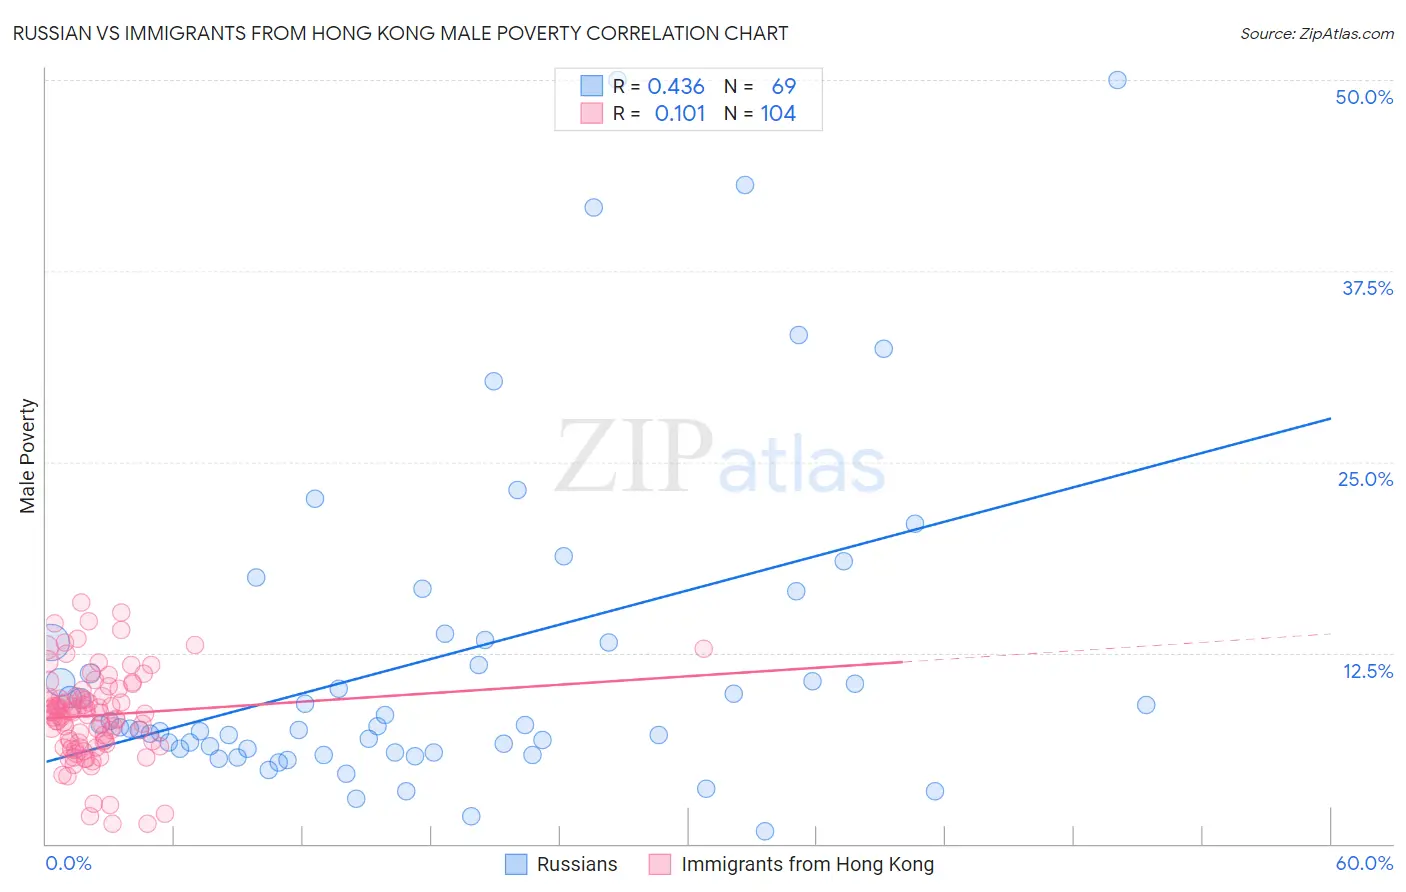
Russian vs Immigrants from Hong Kong Male Poverty Correlation Chart
The statistical analysis conducted on geographies consisting of 511,199,815 people shows a moderate positive correlation between the proportion of Russians and poverty level among males in the United States with a correlation coefficient (R) of 0.436 and weighted average of 9.9%. Similarly, the statistical analysis conducted on geographies consisting of 253,850,467 people shows a poor positive correlation between the proportion of Immigrants from Hong Kong and poverty level among males in the United States with a correlation coefficient (R) of 0.101 and weighted average of 9.6%, a difference of 3.1%.
Male Poverty Correlation Summary
| Measurement | Russian | Immigrants from Hong Kong |
| Minimum | 0.81% | 1.3% |
| Maximum | 50.0% | 15.8% |
| Range | 49.2% | 14.5% |
| Mean | 12.1% | 8.4% |
| Median | 7.7% | 8.6% |
| Interquartile 25% (IQ1) | 6.1% | 6.6% |
| Interquartile 75% (IQ3) | 13.3% | 9.6% |
| Interquartile Range (IQR) | 7.2% | 3.0% |
| Standard Deviation (Sample) | 10.8% | 2.9% |
| Standard Deviation (Population) | 10.8% | 2.9% |
Demographics Similar to Russians and Immigrants from Hong Kong by Male Poverty
In terms of male poverty, the demographic groups most similar to Russians are Immigrants from Pakistan (9.9%, a difference of 0.010%), Immigrants from Greece (9.8%, a difference of 0.38%), Czech (9.8%, a difference of 0.60%), Iranian (9.8%, a difference of 0.69%), and Immigrants from Poland (9.8%, a difference of 1.0%). Similarly, the demographic groups most similar to Immigrants from Hong Kong are Latvian (9.6%, a difference of 0.10%), Immigrants from Scotland (9.6%, a difference of 0.36%), Croatian (9.6%, a difference of 0.61%), Italian (9.6%, a difference of 0.62%), and Swedish (9.6%, a difference of 0.70%).
| Demographics | Rating | Rank | Male Poverty |
| Immigrants | Hong Kong | 99.7 /100 | #19 | Exceptional 9.6% |
| Latvians | 99.7 /100 | #20 | Exceptional 9.6% |
| Immigrants | Scotland | 99.7 /100 | #21 | Exceptional 9.6% |
| Croatians | 99.7 /100 | #22 | Exceptional 9.6% |
| Italians | 99.7 /100 | #23 | Exceptional 9.6% |
| Swedes | 99.7 /100 | #24 | Exceptional 9.6% |
| Eastern Europeans | 99.6 /100 | #25 | Exceptional 9.6% |
| Burmese | 99.6 /100 | #26 | Exceptional 9.7% |
| Danes | 99.6 /100 | #27 | Exceptional 9.7% |
| Immigrants | Korea | 99.6 /100 | #28 | Exceptional 9.7% |
| Greeks | 99.6 /100 | #29 | Exceptional 9.7% |
| Poles | 99.5 /100 | #30 | Exceptional 9.7% |
| Tongans | 99.5 /100 | #31 | Exceptional 9.7% |
| Macedonians | 99.5 /100 | #32 | Exceptional 9.7% |
| Immigrants | Northern Europe | 99.5 /100 | #33 | Exceptional 9.7% |
| Immigrants | Poland | 99.5 /100 | #34 | Exceptional 9.8% |
| Iranians | 99.4 /100 | #35 | Exceptional 9.8% |
| Czechs | 99.4 /100 | #36 | Exceptional 9.8% |
| Immigrants | Greece | 99.3 /100 | #37 | Exceptional 9.8% |
| Immigrants | Pakistan | 99.2 /100 | #38 | Exceptional 9.9% |
| Russians | 99.2 /100 | #39 | Exceptional 9.9% |