Immigrants from Japan vs Lebanese Female Poverty
COMPARE
Immigrants from Japan
Lebanese
Female Poverty
Female Poverty Comparison
Immigrants from Japan
Lebanese
11.9%
FEMALE POVERTY
99.0/ 100
METRIC RATING
48th/ 347
METRIC RANK
13.4%
FEMALE POVERTY
55.9/ 100
METRIC RATING
169th/ 347
METRIC RANK
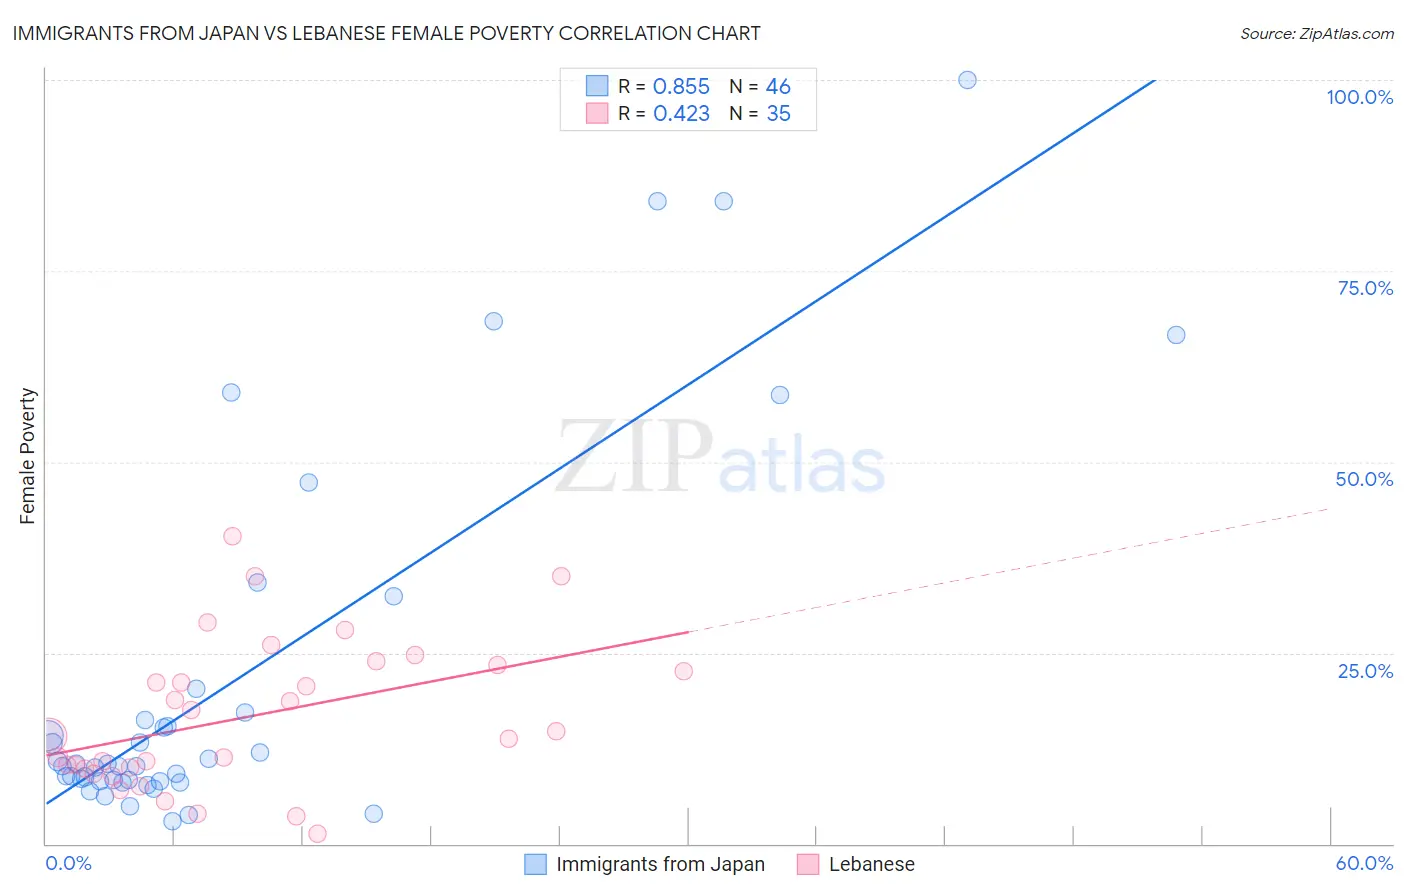
Immigrants from Japan vs Lebanese Female Poverty Correlation Chart
The statistical analysis conducted on geographies consisting of 339,963,649 people shows a very strong positive correlation between the proportion of Immigrants from Japan and poverty level among females in the United States with a correlation coefficient (R) of 0.855 and weighted average of 11.9%. Similarly, the statistical analysis conducted on geographies consisting of 401,241,772 people shows a moderate positive correlation between the proportion of Lebanese and poverty level among females in the United States with a correlation coefficient (R) of 0.423 and weighted average of 13.4%, a difference of 11.8%.
Female Poverty Correlation Summary
| Measurement | Immigrants from Japan | Lebanese |
| Minimum | 2.9% | 1.3% |
| Maximum | 100.0% | 40.3% |
| Range | 97.1% | 38.9% |
| Mean | 21.6% | 16.6% |
| Median | 10.3% | 14.0% |
| Interquartile 25% (IQ1) | 8.2% | 9.8% |
| Interquartile 75% (IQ3) | 17.1% | 23.4% |
| Interquartile Range (IQR) | 9.0% | 13.6% |
| Standard Deviation (Sample) | 24.6% | 9.6% |
| Standard Deviation (Population) | 24.4% | 9.5% |
Similar Demographics by Female Poverty
Demographics Similar to Immigrants from Japan by Female Poverty
In terms of female poverty, the demographic groups most similar to Immigrants from Japan are Immigrants from Romania (12.0%, a difference of 0.19%), Slovene (12.0%, a difference of 0.20%), Asian (11.9%, a difference of 0.23%), Immigrants from Bulgaria (12.0%, a difference of 0.42%), and Turkish (11.9%, a difference of 0.44%).
| Demographics | Rating | Rank | Female Poverty |
| Czechs | 99.2 /100 | #41 | Exceptional 11.9% |
| Immigrants | Moldova | 99.2 /100 | #42 | Exceptional 11.9% |
| Koreans | 99.2 /100 | #43 | Exceptional 11.9% |
| Tongans | 99.2 /100 | #44 | Exceptional 11.9% |
| Immigrants | Czechoslovakia | 99.2 /100 | #45 | Exceptional 11.9% |
| Turks | 99.2 /100 | #46 | Exceptional 11.9% |
| Asians | 99.1 /100 | #47 | Exceptional 11.9% |
| Immigrants | Japan | 99.0 /100 | #48 | Exceptional 11.9% |
| Immigrants | Romania | 99.0 /100 | #49 | Exceptional 12.0% |
| Slovenes | 98.9 /100 | #50 | Exceptional 12.0% |
| Immigrants | Bulgaria | 98.9 /100 | #51 | Exceptional 12.0% |
| Immigrants | Croatia | 98.7 /100 | #52 | Exceptional 12.0% |
| Immigrants | Austria | 98.7 /100 | #53 | Exceptional 12.0% |
| Immigrants | Philippines | 98.7 /100 | #54 | Exceptional 12.1% |
| Immigrants | Sri Lanka | 98.5 /100 | #55 | Exceptional 12.1% |
Demographics Similar to Lebanese by Female Poverty
In terms of female poverty, the demographic groups most similar to Lebanese are Colombian (13.4%, a difference of 0.020%), Aleut (13.4%, a difference of 0.080%), White/Caucasian (13.4%, a difference of 0.13%), Immigrants from Chile (13.3%, a difference of 0.14%), and Mongolian (13.4%, a difference of 0.23%).
| Demographics | Rating | Rank | Female Poverty |
| Guamanians/Chamorros | 62.4 /100 | #162 | Good 13.3% |
| Immigrants | Albania | 62.4 /100 | #163 | Good 13.3% |
| Ethiopians | 62.3 /100 | #164 | Good 13.3% |
| Scotch-Irish | 62.1 /100 | #165 | Good 13.3% |
| Immigrants | Oceania | 59.7 /100 | #166 | Average 13.3% |
| Immigrants | Chile | 57.4 /100 | #167 | Average 13.3% |
| Aleuts | 56.7 /100 | #168 | Average 13.4% |
| Lebanese | 55.9 /100 | #169 | Average 13.4% |
| Colombians | 55.7 /100 | #170 | Average 13.4% |
| Whites/Caucasians | 54.6 /100 | #171 | Average 13.4% |
| Mongolians | 53.6 /100 | #172 | Average 13.4% |
| Immigrants | Afghanistan | 50.8 /100 | #173 | Average 13.4% |
| Immigrants | Iraq | 50.0 /100 | #174 | Average 13.4% |
| Celtics | 49.9 /100 | #175 | Average 13.4% |
| Immigrants | Spain | 49.9 /100 | #176 | Average 13.4% |