White/Caucasian vs Immigrants from Armenia Single Female Poverty
COMPARE
White/Caucasian
Immigrants from Armenia
Single Female Poverty
Single Female Poverty Comparison
Whites/Caucasians
Immigrants from Armenia
22.7%
SINGLE FEMALE POVERTY
0.6/ 100
METRIC RATING
259th/ 347
METRIC RANK
18.7%
SINGLE FEMALE POVERTY
99.9/ 100
METRIC RATING
37th/ 347
METRIC RANK
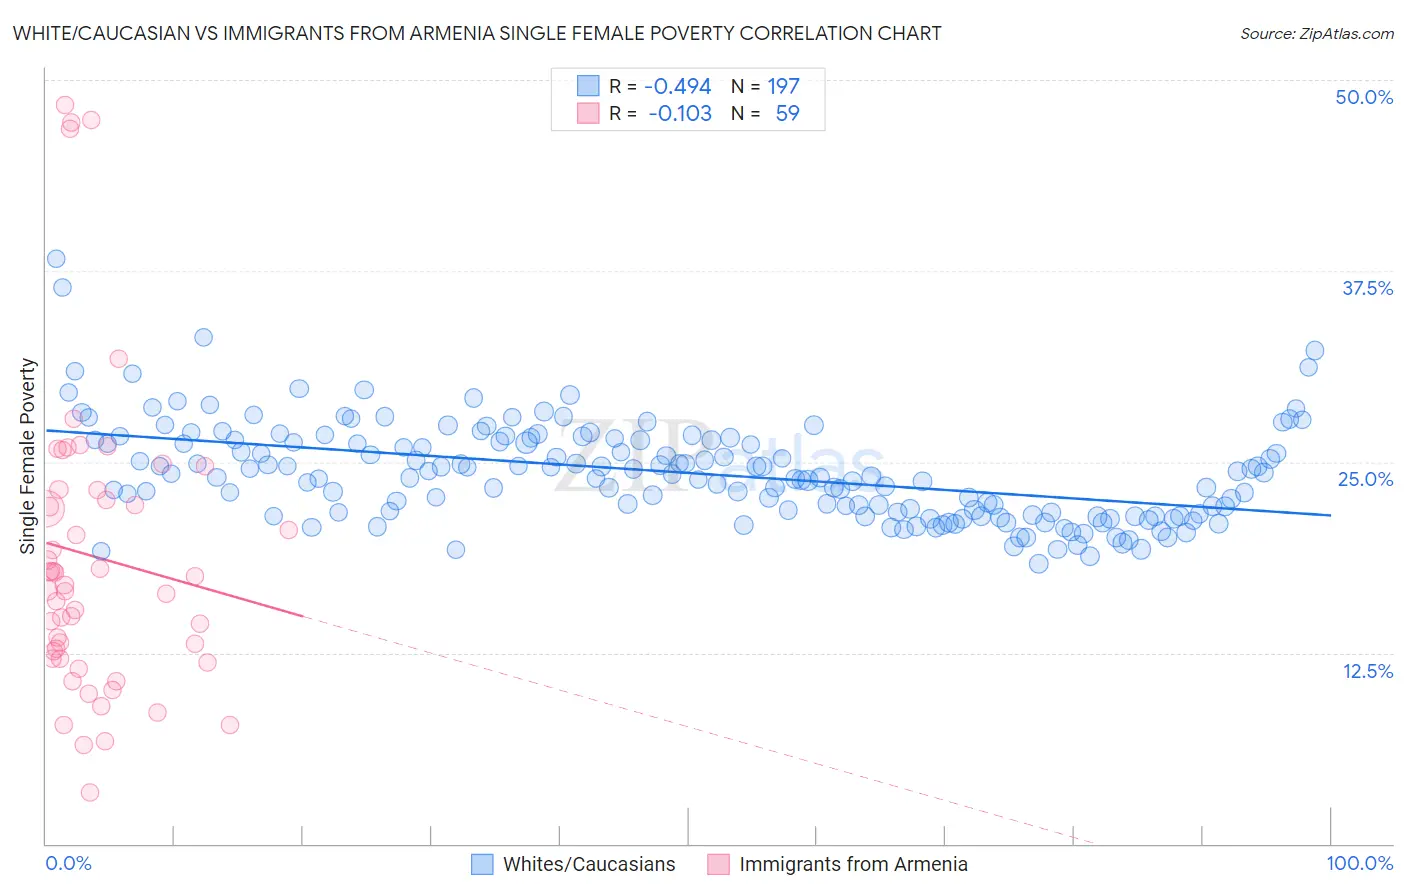
White/Caucasian vs Immigrants from Armenia Single Female Poverty Correlation Chart
The statistical analysis conducted on geographies consisting of 560,395,051 people shows a moderate negative correlation between the proportion of Whites/Caucasians and poverty level among single females in the United States with a correlation coefficient (R) of -0.494 and weighted average of 22.7%. Similarly, the statistical analysis conducted on geographies consisting of 97,216,113 people shows a poor negative correlation between the proportion of Immigrants from Armenia and poverty level among single females in the United States with a correlation coefficient (R) of -0.103 and weighted average of 18.7%, a difference of 21.7%.
Single Female Poverty Correlation Summary
| Measurement | White/Caucasian | Immigrants from Armenia |
| Minimum | 18.3% | 3.3% |
| Maximum | 38.3% | 48.3% |
| Range | 20.0% | 45.0% |
| Mean | 24.3% | 18.8% |
| Median | 24.0% | 16.9% |
| Interquartile 25% (IQ1) | 21.6% | 12.1% |
| Interquartile 75% (IQ3) | 26.4% | 23.2% |
| Interquartile Range (IQR) | 4.8% | 11.0% |
| Standard Deviation (Sample) | 3.2% | 9.9% |
| Standard Deviation (Population) | 3.2% | 9.8% |
Similar Demographics by Single Female Poverty
Demographics Similar to Whites/Caucasians by Single Female Poverty
In terms of single female poverty, the demographic groups most similar to Whites/Caucasians are Celtic (22.7%, a difference of 0.080%), Bahamian (22.7%, a difference of 0.14%), Sudanese (22.6%, a difference of 0.34%), Immigrants from Cabo Verde (22.8%, a difference of 0.34%), and Immigrants from Belize (22.6%, a difference of 0.48%).
| Demographics | Rating | Rank | Single Female Poverty |
| Delaware | 1.0 /100 | #252 | Tragic 22.5% |
| Immigrants | Liberia | 0.9 /100 | #253 | Tragic 22.5% |
| Immigrants | Burma/Myanmar | 0.8 /100 | #254 | Tragic 22.6% |
| Immigrants | Sudan | 0.8 /100 | #255 | Tragic 22.6% |
| Immigrants | Belize | 0.8 /100 | #256 | Tragic 22.6% |
| Sudanese | 0.7 /100 | #257 | Tragic 22.6% |
| Bahamians | 0.6 /100 | #258 | Tragic 22.7% |
| Whites/Caucasians | 0.6 /100 | #259 | Tragic 22.7% |
| Celtics | 0.5 /100 | #260 | Tragic 22.7% |
| Immigrants | Cabo Verde | 0.4 /100 | #261 | Tragic 22.8% |
| British West Indians | 0.4 /100 | #262 | Tragic 22.8% |
| Scotch-Irish | 0.3 /100 | #263 | Tragic 22.9% |
| Immigrants | Laos | 0.3 /100 | #264 | Tragic 22.9% |
| Central Americans | 0.2 /100 | #265 | Tragic 23.0% |
| Immigrants | Micronesia | 0.2 /100 | #266 | Tragic 23.0% |
Demographics Similar to Immigrants from Armenia by Single Female Poverty
In terms of single female poverty, the demographic groups most similar to Immigrants from Armenia are Turkish (18.7%, a difference of 0.020%), Immigrants from Japan (18.6%, a difference of 0.20%), Korean (18.6%, a difference of 0.26%), Immigrants from Philippines (18.6%, a difference of 0.44%), and Immigrants from Sri Lanka (18.6%, a difference of 0.50%).
| Demographics | Rating | Rank | Single Female Poverty |
| Immigrants | North Macedonia | 99.9 /100 | #30 | Exceptional 18.5% |
| Immigrants | Asia | 99.9 /100 | #31 | Exceptional 18.6% |
| Immigrants | Sri Lanka | 99.9 /100 | #32 | Exceptional 18.6% |
| Immigrants | Philippines | 99.9 /100 | #33 | Exceptional 18.6% |
| Koreans | 99.9 /100 | #34 | Exceptional 18.6% |
| Immigrants | Japan | 99.9 /100 | #35 | Exceptional 18.6% |
| Turks | 99.9 /100 | #36 | Exceptional 18.7% |
| Immigrants | Armenia | 99.9 /100 | #37 | Exceptional 18.7% |
| Tongans | 99.9 /100 | #38 | Exceptional 18.8% |
| Bulgarians | 99.9 /100 | #39 | Exceptional 18.8% |
| Okinawans | 99.9 /100 | #40 | Exceptional 18.8% |
| Immigrants | Serbia | 99.9 /100 | #41 | Exceptional 18.8% |
| Jordanians | 99.9 /100 | #42 | Exceptional 18.8% |
| Immigrants | Romania | 99.9 /100 | #43 | Exceptional 18.8% |
| Immigrants | Croatia | 99.9 /100 | #44 | Exceptional 18.9% |