Immigrants from Ireland vs Haitian Married-Couple Family Poverty
COMPARE
Immigrants from Ireland
Haitian
Married-Couple Family Poverty
Married-Couple Family Poverty Comparison
Immigrants from Ireland
Haitians
4.1%
MARRIED-COUPLE FAMILY POVERTY
99.9/ 100
METRIC RATING
19th/ 347
METRIC RANK
6.8%
MARRIED-COUPLE FAMILY POVERTY
0.0/ 100
METRIC RATING
305th/ 347
METRIC RANK
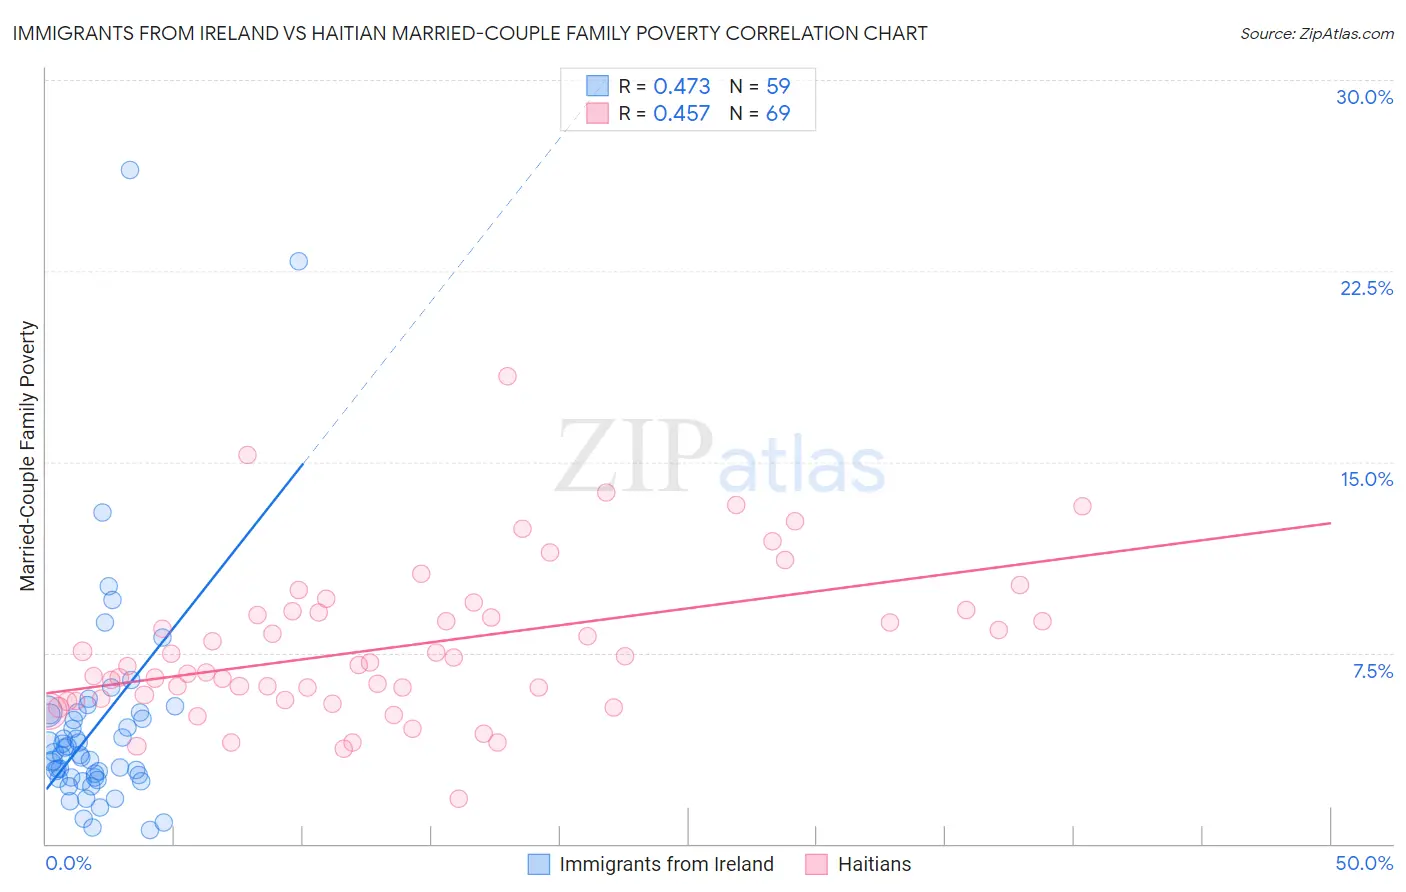
Immigrants from Ireland vs Haitian Married-Couple Family Poverty Correlation Chart
The statistical analysis conducted on geographies consisting of 239,104,626 people shows a moderate positive correlation between the proportion of Immigrants from Ireland and poverty level among married-couple families in the United States with a correlation coefficient (R) of 0.473 and weighted average of 4.1%. Similarly, the statistical analysis conducted on geographies consisting of 285,930,838 people shows a moderate positive correlation between the proportion of Haitians and poverty level among married-couple families in the United States with a correlation coefficient (R) of 0.457 and weighted average of 6.8%, a difference of 67.2%.
Married-Couple Family Poverty Correlation Summary
| Measurement | Immigrants from Ireland | Haitian |
| Minimum | 0.56% | 1.8% |
| Maximum | 26.5% | 18.4% |
| Range | 25.9% | 16.6% |
| Mean | 4.7% | 7.7% |
| Median | 3.5% | 7.0% |
| Interquartile 25% (IQ1) | 2.6% | 5.7% |
| Interquartile 75% (IQ3) | 5.1% | 9.1% |
| Interquartile Range (IQR) | 2.5% | 3.4% |
| Standard Deviation (Sample) | 4.4% | 3.0% |
| Standard Deviation (Population) | 4.4% | 3.0% |
Similar Demographics by Married-Couple Family Poverty
Demographics Similar to Immigrants from Ireland by Married-Couple Family Poverty
In terms of married-couple family poverty, the demographic groups most similar to Immigrants from Ireland are Maltese (4.1%, a difference of 0.25%), Zimbabwean (4.1%, a difference of 0.27%), Immigrants from Singapore (4.1%, a difference of 0.64%), Bhutanese (4.1%, a difference of 0.66%), and Italian (4.0%, a difference of 0.78%).
| Demographics | Rating | Rank | Married-Couple Family Poverty |
| Bulgarians | 100.0 /100 | #12 | Exceptional 4.0% |
| Czechs | 100.0 /100 | #13 | Exceptional 4.0% |
| Slovaks | 100.0 /100 | #14 | Exceptional 4.0% |
| Poles | 100.0 /100 | #15 | Exceptional 4.0% |
| Germans | 100.0 /100 | #16 | Exceptional 4.0% |
| Filipinos | 100.0 /100 | #17 | Exceptional 4.0% |
| Italians | 100.0 /100 | #18 | Exceptional 4.0% |
| Immigrants | Ireland | 99.9 /100 | #19 | Exceptional 4.1% |
| Maltese | 99.9 /100 | #20 | Exceptional 4.1% |
| Zimbabweans | 99.9 /100 | #21 | Exceptional 4.1% |
| Immigrants | Singapore | 99.9 /100 | #22 | Exceptional 4.1% |
| Bhutanese | 99.9 /100 | #23 | Exceptional 4.1% |
| Eastern Europeans | 99.9 /100 | #24 | Exceptional 4.1% |
| Immigrants | Taiwan | 99.9 /100 | #25 | Exceptional 4.1% |
| Cypriots | 99.9 /100 | #26 | Exceptional 4.1% |
Demographics Similar to Haitians by Married-Couple Family Poverty
In terms of married-couple family poverty, the demographic groups most similar to Haitians are Cuban (6.8%, a difference of 0.10%), Immigrants from El Salvador (6.8%, a difference of 0.55%), Immigrants from Ecuador (6.7%, a difference of 0.83%), Central American (6.7%, a difference of 0.97%), and Immigrants from Belize (6.7%, a difference of 1.6%).
| Demographics | Rating | Rank | Married-Couple Family Poverty |
| Immigrants | Guyana | 0.0 /100 | #298 | Tragic 6.7% |
| Nicaraguans | 0.0 /100 | #299 | Tragic 6.7% |
| Immigrants | Belize | 0.0 /100 | #300 | Tragic 6.7% |
| Central Americans | 0.0 /100 | #301 | Tragic 6.7% |
| Immigrants | Ecuador | 0.0 /100 | #302 | Tragic 6.7% |
| Immigrants | El Salvador | 0.0 /100 | #303 | Tragic 6.8% |
| Cubans | 0.0 /100 | #304 | Tragic 6.8% |
| Haitians | 0.0 /100 | #305 | Tragic 6.8% |
| Immigrants | Haiti | 0.0 /100 | #306 | Tragic 7.0% |
| Guatemalans | 0.0 /100 | #307 | Tragic 7.0% |
| Spanish American Indians | 0.0 /100 | #308 | Tragic 7.1% |
| Hopi | 0.0 /100 | #309 | Tragic 7.1% |
| Immigrants | Nicaragua | 0.0 /100 | #310 | Tragic 7.1% |
| Immigrants | Dominica | 0.0 /100 | #311 | Tragic 7.1% |
| Immigrants | Armenia | 0.0 /100 | #312 | Tragic 7.1% |