Immigrants from Ireland vs Haitian Householder Income Over 65 years
COMPARE
Immigrants from Ireland
Haitian
Householder Income Over 65 years
Householder Income Over 65 years Comparison
Immigrants from Ireland
Haitians
$68,495
HOUSEHOLDER INCOME OVER 65 YEARS
100.0/ 100
METRIC RATING
34th/ 347
METRIC RANK
$51,912
HOUSEHOLDER INCOME OVER 65 YEARS
0.0/ 100
METRIC RATING
318th/ 347
METRIC RANK
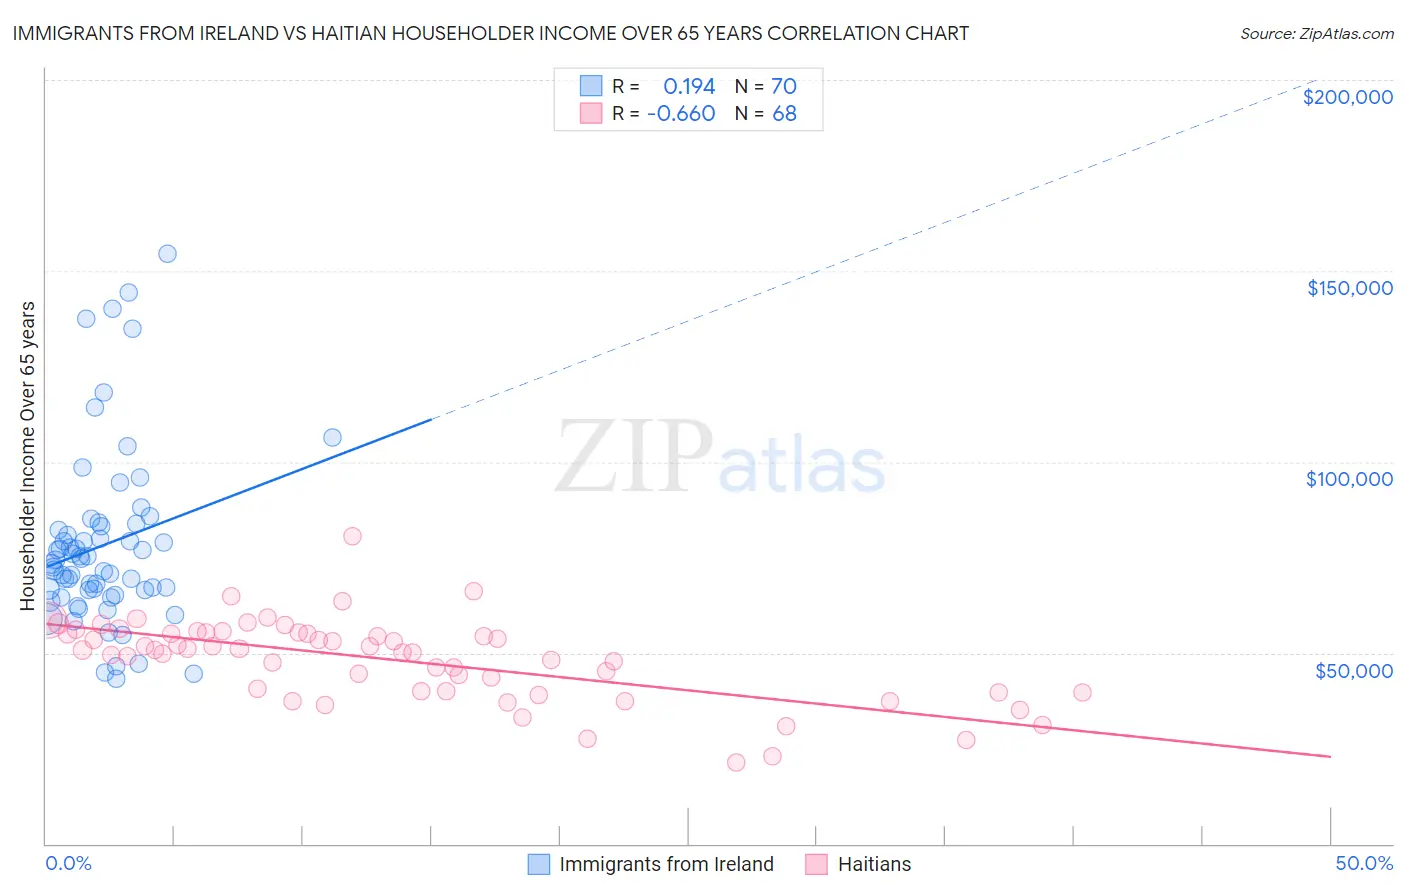
Immigrants from Ireland vs Haitian Householder Income Over 65 years Correlation Chart
The statistical analysis conducted on geographies consisting of 240,465,056 people shows a poor positive correlation between the proportion of Immigrants from Ireland and household income with householder over the age of 65 in the United States with a correlation coefficient (R) of 0.194 and weighted average of $68,495. Similarly, the statistical analysis conducted on geographies consisting of 286,836,120 people shows a significant negative correlation between the proportion of Haitians and household income with householder over the age of 65 in the United States with a correlation coefficient (R) of -0.660 and weighted average of $51,912, a difference of 32.0%.
Householder Income Over 65 years Correlation Summary
| Measurement | Immigrants from Ireland | Haitian |
| Minimum | $43,125 | $21,207 |
| Maximum | $154,545 | $80,361 |
| Range | $111,420 | $59,154 |
| Mean | $78,195 | $48,246 |
| Median | $73,743 | $50,679 |
| Interquartile 25% (IQ1) | $66,428 | $39,901 |
| Interquartile 75% (IQ3) | $83,026 | $55,223 |
| Interquartile Range (IQR) | $16,598 | $15,322 |
| Standard Deviation (Sample) | $23,254 | $10,731 |
| Standard Deviation (Population) | $23,087 | $10,652 |
Similar Demographics by Householder Income Over 65 years
Demographics Similar to Immigrants from Ireland by Householder Income Over 65 years
In terms of householder income over 65 years, the demographic groups most similar to Immigrants from Ireland are Tongan ($68,235, a difference of 0.38%), Immigrants from Austria ($68,208, a difference of 0.42%), Immigrants from Denmark ($68,801, a difference of 0.45%), Asian ($68,822, a difference of 0.48%), and Afghan ($68,951, a difference of 0.67%).
| Demographics | Rating | Rank | Householder Income Over 65 years |
| Immigrants | Switzerland | 100.0 /100 | #27 | Exceptional $69,343 |
| Immigrants | China | 100.0 /100 | #28 | Exceptional $69,174 |
| Immigrants | Australia | 100.0 /100 | #29 | Exceptional $69,164 |
| Immigrants | Northern Europe | 100.0 /100 | #30 | Exceptional $69,003 |
| Afghans | 100.0 /100 | #31 | Exceptional $68,951 |
| Asians | 100.0 /100 | #32 | Exceptional $68,822 |
| Immigrants | Denmark | 100.0 /100 | #33 | Exceptional $68,801 |
| Immigrants | Ireland | 100.0 /100 | #34 | Exceptional $68,495 |
| Tongans | 100.0 /100 | #35 | Exceptional $68,235 |
| Immigrants | Austria | 99.9 /100 | #36 | Exceptional $68,208 |
| Turks | 99.9 /100 | #37 | Exceptional $68,037 |
| Estonians | 99.9 /100 | #38 | Exceptional $67,926 |
| Russians | 99.9 /100 | #39 | Exceptional $67,626 |
| Immigrants | Asia | 99.9 /100 | #40 | Exceptional $67,594 |
| Koreans | 99.9 /100 | #41 | Exceptional $67,472 |
Demographics Similar to Haitians by Householder Income Over 65 years
In terms of householder income over 65 years, the demographic groups most similar to Haitians are Immigrants from St. Vincent and the Grenadines ($51,922, a difference of 0.020%), Immigrants from Honduras ($51,888, a difference of 0.050%), Creek ($51,949, a difference of 0.070%), U.S. Virgin Islander ($52,072, a difference of 0.31%), and Immigrants from Nicaragua ($52,085, a difference of 0.33%).
| Demographics | Rating | Rank | Householder Income Over 65 years |
| Seminole | 0.0 /100 | #311 | Tragic $52,373 |
| Immigrants | Azores | 0.0 /100 | #312 | Tragic $52,121 |
| Immigrants | Nicaragua | 0.0 /100 | #313 | Tragic $52,085 |
| Natives/Alaskans | 0.0 /100 | #314 | Tragic $52,081 |
| U.S. Virgin Islanders | 0.0 /100 | #315 | Tragic $52,072 |
| Creek | 0.0 /100 | #316 | Tragic $51,949 |
| Immigrants | St. Vincent and the Grenadines | 0.0 /100 | #317 | Tragic $51,922 |
| Haitians | 0.0 /100 | #318 | Tragic $51,912 |
| Immigrants | Honduras | 0.0 /100 | #319 | Tragic $51,888 |
| Colville | 0.0 /100 | #320 | Tragic $51,739 |
| Menominee | 0.0 /100 | #321 | Tragic $51,719 |
| British West Indians | 0.0 /100 | #322 | Tragic $51,463 |
| Cajuns | 0.0 /100 | #323 | Tragic $51,397 |
| Immigrants | Congo | 0.0 /100 | #324 | Tragic $51,393 |
| Immigrants | Haiti | 0.0 /100 | #325 | Tragic $51,219 |