Immigrants from Iraq vs Ghanaian Female Poverty
COMPARE
Immigrants from Iraq
Ghanaian
Female Poverty
Female Poverty Comparison
Immigrants from Iraq
Ghanaians
13.4%
FEMALE POVERTY
50.0/ 100
METRIC RATING
174th/ 347
METRIC RANK
14.7%
FEMALE POVERTY
1.9/ 100
METRIC RATING
229th/ 347
METRIC RANK
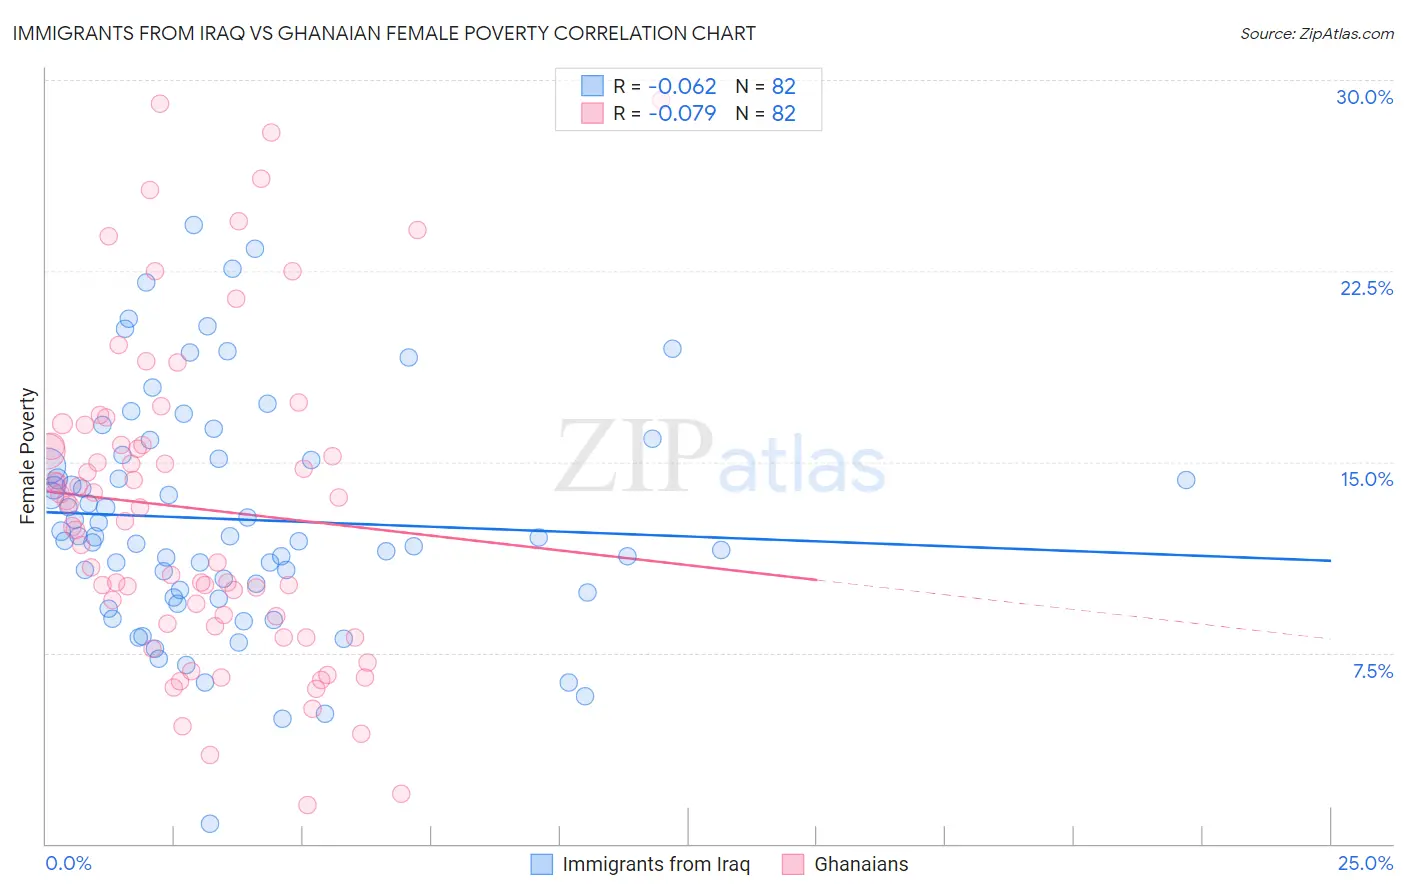
Immigrants from Iraq vs Ghanaian Female Poverty Correlation Chart
The statistical analysis conducted on geographies consisting of 194,711,025 people shows a slight negative correlation between the proportion of Immigrants from Iraq and poverty level among females in the United States with a correlation coefficient (R) of -0.062 and weighted average of 13.4%. Similarly, the statistical analysis conducted on geographies consisting of 190,346,829 people shows a slight negative correlation between the proportion of Ghanaians and poverty level among females in the United States with a correlation coefficient (R) of -0.079 and weighted average of 14.7%, a difference of 9.5%.
Female Poverty Correlation Summary
| Measurement | Immigrants from Iraq | Ghanaian |
| Minimum | 0.80% | 1.5% |
| Maximum | 24.3% | 29.2% |
| Range | 23.5% | 27.7% |
| Mean | 12.7% | 13.2% |
| Median | 12.1% | 12.9% |
| Interquartile 25% (IQ1) | 9.8% | 8.6% |
| Interquartile 75% (IQ3) | 15.1% | 15.7% |
| Interquartile Range (IQR) | 5.3% | 7.1% |
| Standard Deviation (Sample) | 4.5% | 6.3% |
| Standard Deviation (Population) | 4.5% | 6.2% |
Similar Demographics by Female Poverty
Demographics Similar to Immigrants from Iraq by Female Poverty
In terms of female poverty, the demographic groups most similar to Immigrants from Iraq are Celtic (13.4%, a difference of 0.010%), Immigrants from Spain (13.4%, a difference of 0.010%), Immigrants from Morocco (13.4%, a difference of 0.060%), Immigrants from Afghanistan (13.4%, a difference of 0.070%), and Israeli (13.5%, a difference of 0.090%).
| Demographics | Rating | Rank | Female Poverty |
| Immigrants | Chile | 57.4 /100 | #167 | Average 13.3% |
| Aleuts | 56.7 /100 | #168 | Average 13.4% |
| Lebanese | 55.9 /100 | #169 | Average 13.4% |
| Colombians | 55.7 /100 | #170 | Average 13.4% |
| Whites/Caucasians | 54.6 /100 | #171 | Average 13.4% |
| Mongolians | 53.6 /100 | #172 | Average 13.4% |
| Immigrants | Afghanistan | 50.8 /100 | #173 | Average 13.4% |
| Immigrants | Iraq | 50.0 /100 | #174 | Average 13.4% |
| Celtics | 49.9 /100 | #175 | Average 13.4% |
| Immigrants | Spain | 49.9 /100 | #176 | Average 13.4% |
| Immigrants | Morocco | 49.4 /100 | #177 | Average 13.4% |
| Israelis | 49.1 /100 | #178 | Average 13.5% |
| Immigrants | Syria | 48.8 /100 | #179 | Average 13.5% |
| South Americans | 44.8 /100 | #180 | Average 13.5% |
| Venezuelans | 44.5 /100 | #181 | Average 13.5% |
Demographics Similar to Ghanaians by Female Poverty
In terms of female poverty, the demographic groups most similar to Ghanaians are German Russian (14.7%, a difference of 0.060%), Alaska Native (14.7%, a difference of 0.20%), Immigrants from Nigeria (14.7%, a difference of 0.21%), Nigerian (14.8%, a difference of 0.30%), and Immigrants from Eritrea (14.6%, a difference of 0.52%).
| Demographics | Rating | Rank | Female Poverty |
| Immigrants | Nonimmigrants | 3.7 /100 | #222 | Tragic 14.5% |
| Immigrants | Africa | 3.3 /100 | #223 | Tragic 14.5% |
| Americans | 2.8 /100 | #224 | Tragic 14.6% |
| Immigrants | Micronesia | 2.8 /100 | #225 | Tragic 14.6% |
| Immigrants | Eritrea | 2.4 /100 | #226 | Tragic 14.6% |
| Immigrants | Nigeria | 2.1 /100 | #227 | Tragic 14.7% |
| German Russians | 2.0 /100 | #228 | Tragic 14.7% |
| Ghanaians | 1.9 /100 | #229 | Tragic 14.7% |
| Alaska Natives | 1.8 /100 | #230 | Tragic 14.7% |
| Nigerians | 1.7 /100 | #231 | Tragic 14.8% |
| Osage | 1.5 /100 | #232 | Tragic 14.8% |
| Immigrants | Saudi Arabia | 1.4 /100 | #233 | Tragic 14.8% |
| Fijians | 1.1 /100 | #234 | Tragic 14.9% |
| Immigrants | Laos | 0.9 /100 | #235 | Tragic 15.0% |
| Cree | 0.7 /100 | #236 | Tragic 15.1% |