Immigrants from Indonesia vs Iroquois Hearing Disability
COMPARE
Immigrants from Indonesia
Iroquois
Hearing Disability
Hearing Disability Comparison
Immigrants from Indonesia
Iroquois
2.8%
HEARING DISABILITY
94.7/ 100
METRIC RATING
103rd/ 347
METRIC RANK
3.7%
HEARING DISABILITY
0.0/ 100
METRIC RATING
294th/ 347
METRIC RANK
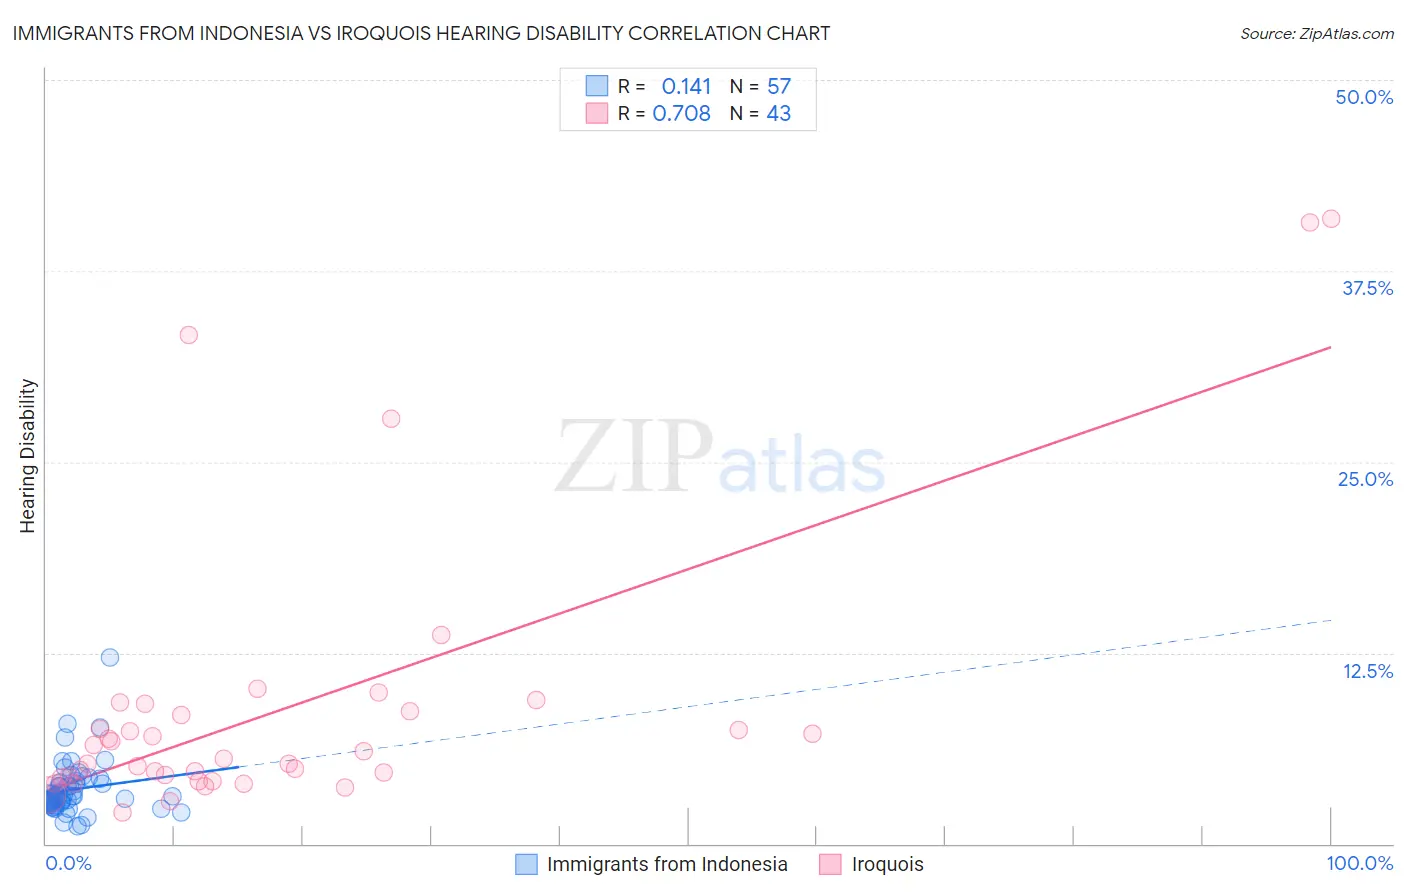
Immigrants from Indonesia vs Iroquois Hearing Disability Correlation Chart
The statistical analysis conducted on geographies consisting of 215,771,622 people shows a poor positive correlation between the proportion of Immigrants from Indonesia and percentage of population with hearing disability in the United States with a correlation coefficient (R) of 0.141 and weighted average of 2.8%. Similarly, the statistical analysis conducted on geographies consisting of 207,234,174 people shows a strong positive correlation between the proportion of Iroquois and percentage of population with hearing disability in the United States with a correlation coefficient (R) of 0.708 and weighted average of 3.7%, a difference of 32.5%.
Hearing Disability Correlation Summary
| Measurement | Immigrants from Indonesia | Iroquois |
| Minimum | 1.2% | 2.0% |
| Maximum | 12.2% | 40.9% |
| Range | 11.0% | 38.9% |
| Mean | 3.6% | 8.8% |
| Median | 3.1% | 5.6% |
| Interquartile 25% (IQ1) | 2.6% | 4.3% |
| Interquartile 75% (IQ3) | 4.1% | 8.7% |
| Interquartile Range (IQR) | 1.5% | 4.4% |
| Standard Deviation (Sample) | 1.8% | 9.2% |
| Standard Deviation (Population) | 1.8% | 9.1% |
Similar Demographics by Hearing Disability
Demographics Similar to Immigrants from Indonesia by Hearing Disability
In terms of hearing disability, the demographic groups most similar to Immigrants from Indonesia are Taiwanese (2.8%, a difference of 0.050%), Immigrants from Spain (2.8%, a difference of 0.060%), Immigrants from Eastern Africa (2.8%, a difference of 0.12%), Immigrants from Guatemala (2.8%, a difference of 0.17%), and Immigrants from Honduras (2.8%, a difference of 0.21%).
| Demographics | Rating | Rank | Hearing Disability |
| Immigrants | Somalia | 95.5 /100 | #96 | Exceptional 2.8% |
| Immigrants | Afghanistan | 95.3 /100 | #97 | Exceptional 2.8% |
| Immigrants | Honduras | 95.1 /100 | #98 | Exceptional 2.8% |
| Immigrants | Guatemala | 95.1 /100 | #99 | Exceptional 2.8% |
| Immigrants | Eastern Africa | 95.0 /100 | #100 | Exceptional 2.8% |
| Immigrants | Spain | 94.9 /100 | #101 | Exceptional 2.8% |
| Taiwanese | 94.8 /100 | #102 | Exceptional 2.8% |
| Immigrants | Indonesia | 94.7 /100 | #103 | Exceptional 2.8% |
| Burmese | 94.2 /100 | #104 | Exceptional 2.8% |
| Moroccans | 93.9 /100 | #105 | Exceptional 2.8% |
| Hondurans | 93.4 /100 | #106 | Exceptional 2.8% |
| Immigrants | Chile | 93.4 /100 | #107 | Exceptional 2.8% |
| Guatemalans | 93.2 /100 | #108 | Exceptional 2.8% |
| Turks | 93.0 /100 | #109 | Exceptional 2.8% |
| Cypriots | 92.9 /100 | #110 | Exceptional 2.8% |
Demographics Similar to Iroquois by Hearing Disability
In terms of hearing disability, the demographic groups most similar to Iroquois are Norwegian (3.7%, a difference of 0.24%), Welsh (3.7%, a difference of 0.27%), Native Hawaiian (3.7%, a difference of 0.30%), Finnish (3.7%, a difference of 0.36%), and White/Caucasian (3.7%, a difference of 0.37%).
| Demographics | Rating | Rank | Hearing Disability |
| Spanish | 0.0 /100 | #287 | Tragic 3.7% |
| Irish | 0.0 /100 | #288 | Tragic 3.7% |
| Chinese | 0.0 /100 | #289 | Tragic 3.7% |
| Whites/Caucasians | 0.0 /100 | #290 | Tragic 3.7% |
| Finns | 0.0 /100 | #291 | Tragic 3.7% |
| Native Hawaiians | 0.0 /100 | #292 | Tragic 3.7% |
| Norwegians | 0.0 /100 | #293 | Tragic 3.7% |
| Iroquois | 0.0 /100 | #294 | Tragic 3.7% |
| Welsh | 0.0 /100 | #295 | Tragic 3.7% |
| Pima | 0.0 /100 | #296 | Tragic 3.7% |
| Immigrants | Azores | 0.0 /100 | #297 | Tragic 3.7% |
| Celtics | 0.0 /100 | #298 | Tragic 3.7% |
| Germans | 0.0 /100 | #299 | Tragic 3.7% |
| Scottish | 0.0 /100 | #300 | Tragic 3.7% |
| Pennsylvania Germans | 0.0 /100 | #301 | Tragic 3.7% |