Immigrants from India vs Immigrants from Jamaica Female Poverty
COMPARE
Immigrants from India
Immigrants from Jamaica
Female Poverty
Female Poverty Comparison
Immigrants from India
Immigrants from Jamaica
9.9%
FEMALE POVERTY
100.0/ 100
METRIC RATING
1st/ 347
METRIC RANK
15.6%
FEMALE POVERTY
0.1/ 100
METRIC RATING
257th/ 347
METRIC RANK
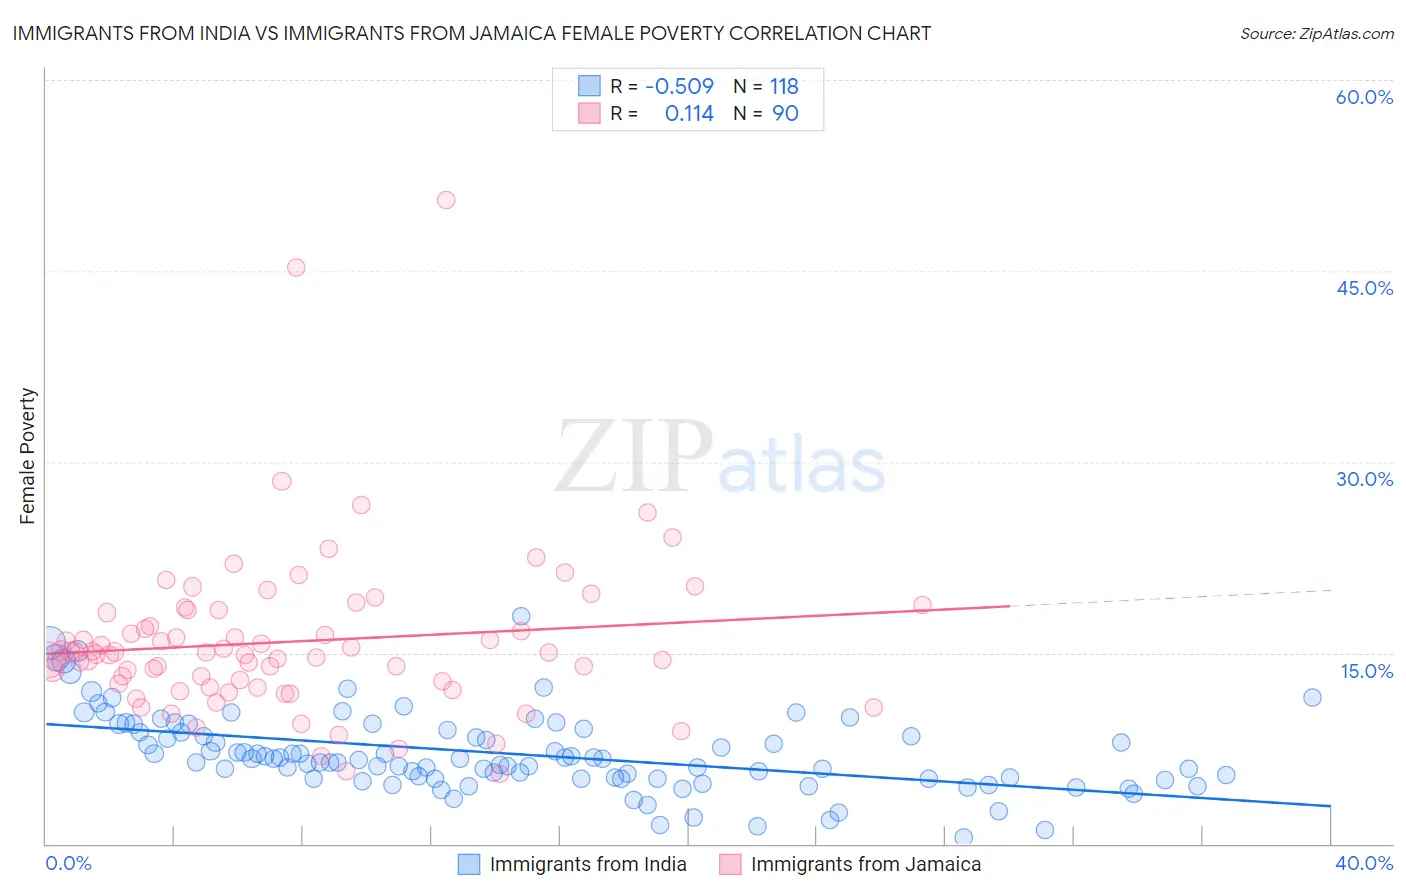
Immigrants from India vs Immigrants from Jamaica Female Poverty Correlation Chart
The statistical analysis conducted on geographies consisting of 433,627,117 people shows a substantial negative correlation between the proportion of Immigrants from India and poverty level among females in the United States with a correlation coefficient (R) of -0.509 and weighted average of 9.9%. Similarly, the statistical analysis conducted on geographies consisting of 301,557,879 people shows a poor positive correlation between the proportion of Immigrants from Jamaica and poverty level among females in the United States with a correlation coefficient (R) of 0.114 and weighted average of 15.6%, a difference of 57.4%.
Female Poverty Correlation Summary
| Measurement | Immigrants from India | Immigrants from Jamaica |
| Minimum | 0.46% | 5.5% |
| Maximum | 17.9% | 50.6% |
| Range | 17.5% | 45.1% |
| Mean | 7.1% | 15.9% |
| Median | 6.7% | 15.0% |
| Interquartile 25% (IQ1) | 5.1% | 12.6% |
| Interquartile 75% (IQ3) | 9.0% | 18.2% |
| Interquartile Range (IQR) | 3.8% | 5.6% |
| Standard Deviation (Sample) | 3.1% | 6.6% |
| Standard Deviation (Population) | 3.1% | 6.5% |
Similar Demographics by Female Poverty
Demographics Similar to Immigrants from India by Female Poverty
In terms of female poverty, the demographic groups most similar to Immigrants from India are Chinese (10.4%, a difference of 5.2%), Thai (10.5%, a difference of 5.9%), Immigrants from Taiwan (10.5%, a difference of 6.7%), Filipino (10.9%, a difference of 10.8%), and Immigrants from Ireland (11.0%, a difference of 11.3%).
| Demographics | Rating | Rank | Female Poverty |
| Immigrants | India | 100.0 /100 | #1 | Exceptional 9.9% |
| Chinese | 100.0 /100 | #2 | Exceptional 10.4% |
| Thais | 100.0 /100 | #3 | Exceptional 10.5% |
| Immigrants | Taiwan | 100.0 /100 | #4 | Exceptional 10.5% |
| Filipinos | 100.0 /100 | #5 | Exceptional 10.9% |
| Immigrants | Ireland | 99.9 /100 | #6 | Exceptional 11.0% |
| Assyrians/Chaldeans/Syriacs | 99.9 /100 | #7 | Exceptional 11.0% |
| Immigrants | South Central Asia | 99.9 /100 | #8 | Exceptional 11.1% |
| Bulgarians | 99.9 /100 | #9 | Exceptional 11.1% |
| Immigrants | Hong Kong | 99.9 /100 | #10 | Exceptional 11.2% |
| Maltese | 99.9 /100 | #11 | Exceptional 11.2% |
| Bhutanese | 99.9 /100 | #12 | Exceptional 11.3% |
| Immigrants | Lithuania | 99.9 /100 | #13 | Exceptional 11.3% |
| Lithuanians | 99.8 /100 | #14 | Exceptional 11.4% |
| Latvians | 99.8 /100 | #15 | Exceptional 11.4% |
Demographics Similar to Immigrants from Jamaica by Female Poverty
In terms of female poverty, the demographic groups most similar to Immigrants from Jamaica are Shoshone (15.6%, a difference of 0.060%), Jamaican (15.5%, a difference of 0.12%), Cape Verdean (15.6%, a difference of 0.18%), Immigrants from Guyana (15.6%, a difference of 0.25%), and Guyanese (15.6%, a difference of 0.35%).
| Demographics | Rating | Rank | Female Poverty |
| Immigrants | Western Africa | 0.3 /100 | #250 | Tragic 15.3% |
| Immigrants | Trinidad and Tobago | 0.3 /100 | #251 | Tragic 15.4% |
| Immigrants | Burma/Myanmar | 0.3 /100 | #252 | Tragic 15.4% |
| Liberians | 0.2 /100 | #253 | Tragic 15.4% |
| Trinidadians and Tobagonians | 0.2 /100 | #254 | Tragic 15.4% |
| Ottawa | 0.2 /100 | #255 | Tragic 15.5% |
| Jamaicans | 0.2 /100 | #256 | Tragic 15.5% |
| Immigrants | Jamaica | 0.1 /100 | #257 | Tragic 15.6% |
| Shoshone | 0.1 /100 | #258 | Tragic 15.6% |
| Cape Verdeans | 0.1 /100 | #259 | Tragic 15.6% |
| Immigrants | Guyana | 0.1 /100 | #260 | Tragic 15.6% |
| Guyanese | 0.1 /100 | #261 | Tragic 15.6% |
| Mexican American Indians | 0.1 /100 | #262 | Tragic 15.6% |
| Cherokee | 0.1 /100 | #263 | Tragic 15.6% |
| Immigrants | Ecuador | 0.1 /100 | #264 | Tragic 15.6% |