Immigrants from India vs Immigrants from Western Africa Female Poverty
COMPARE
Immigrants from India
Immigrants from Western Africa
Female Poverty
Female Poverty Comparison
Immigrants from India
Immigrants from Western Africa
9.9%
FEMALE POVERTY
100.0/ 100
METRIC RATING
1st/ 347
METRIC RANK
15.3%
FEMALE POVERTY
0.3/ 100
METRIC RATING
250th/ 347
METRIC RANK
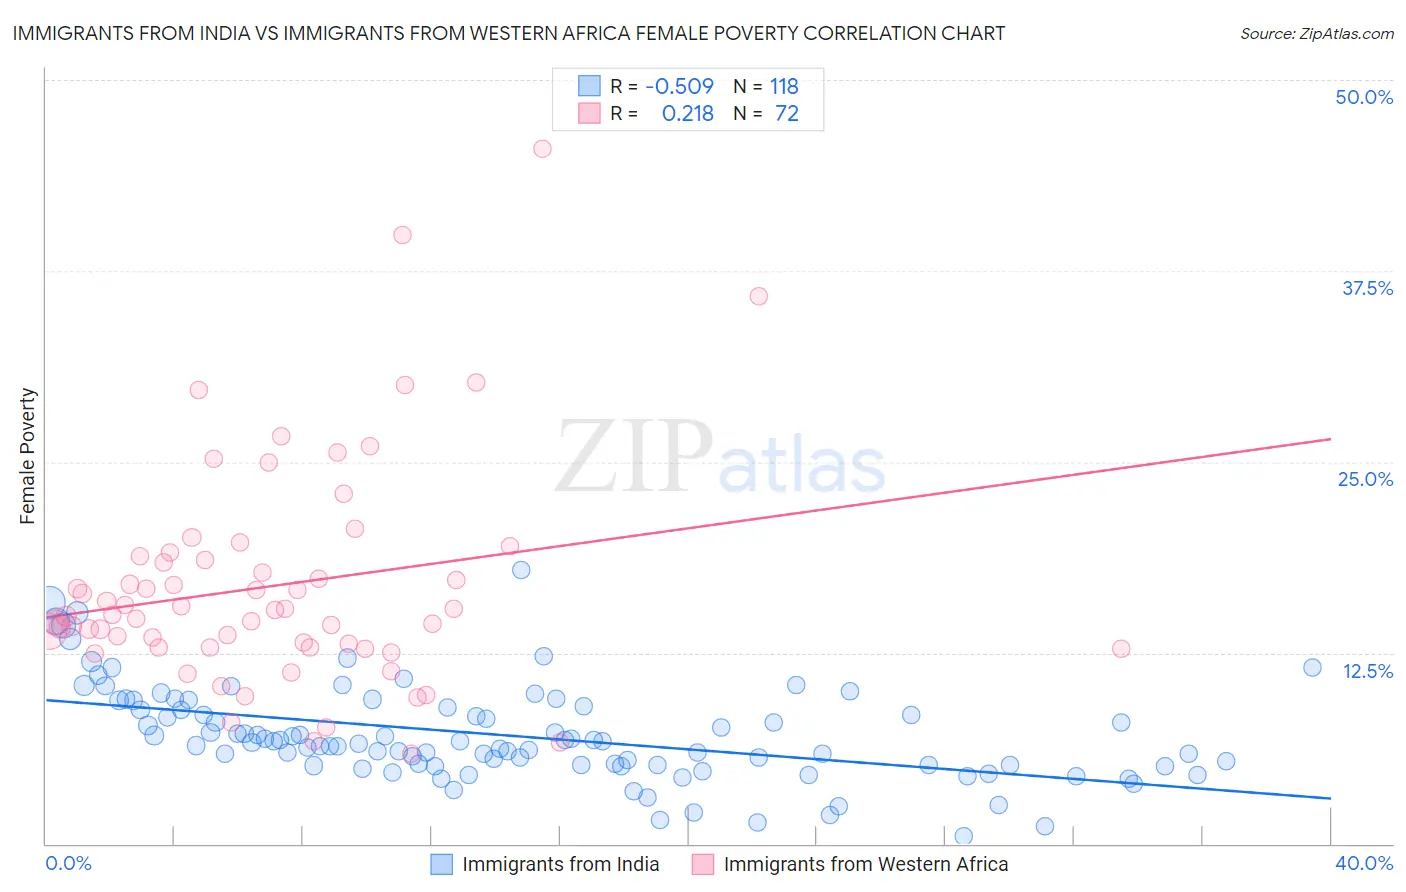
Immigrants from India vs Immigrants from Western Africa Female Poverty Correlation Chart
The statistical analysis conducted on geographies consisting of 433,627,117 people shows a substantial negative correlation between the proportion of Immigrants from India and poverty level among females in the United States with a correlation coefficient (R) of -0.509 and weighted average of 9.9%. Similarly, the statistical analysis conducted on geographies consisting of 357,511,733 people shows a weak positive correlation between the proportion of Immigrants from Western Africa and poverty level among females in the United States with a correlation coefficient (R) of 0.218 and weighted average of 15.3%, a difference of 55.2%.
Female Poverty Correlation Summary
| Measurement | Immigrants from India | Immigrants from Western Africa |
| Minimum | 0.46% | 5.9% |
| Maximum | 17.9% | 45.5% |
| Range | 17.5% | 39.6% |
| Mean | 7.1% | 16.9% |
| Median | 6.7% | 15.1% |
| Interquartile 25% (IQ1) | 5.1% | 12.8% |
| Interquartile 75% (IQ3) | 9.0% | 18.7% |
| Interquartile Range (IQR) | 3.8% | 5.9% |
| Standard Deviation (Sample) | 3.1% | 7.3% |
| Standard Deviation (Population) | 3.1% | 7.2% |
Similar Demographics by Female Poverty
Demographics Similar to Immigrants from India by Female Poverty
In terms of female poverty, the demographic groups most similar to Immigrants from India are Chinese (10.4%, a difference of 5.2%), Thai (10.5%, a difference of 5.9%), Immigrants from Taiwan (10.5%, a difference of 6.7%), Filipino (10.9%, a difference of 10.8%), and Immigrants from Ireland (11.0%, a difference of 11.3%).
| Demographics | Rating | Rank | Female Poverty |
| Immigrants | India | 100.0 /100 | #1 | Exceptional 9.9% |
| Chinese | 100.0 /100 | #2 | Exceptional 10.4% |
| Thais | 100.0 /100 | #3 | Exceptional 10.5% |
| Immigrants | Taiwan | 100.0 /100 | #4 | Exceptional 10.5% |
| Filipinos | 100.0 /100 | #5 | Exceptional 10.9% |
| Immigrants | Ireland | 99.9 /100 | #6 | Exceptional 11.0% |
| Assyrians/Chaldeans/Syriacs | 99.9 /100 | #7 | Exceptional 11.0% |
| Immigrants | South Central Asia | 99.9 /100 | #8 | Exceptional 11.1% |
| Bulgarians | 99.9 /100 | #9 | Exceptional 11.1% |
| Immigrants | Hong Kong | 99.9 /100 | #10 | Exceptional 11.2% |
| Maltese | 99.9 /100 | #11 | Exceptional 11.2% |
| Bhutanese | 99.9 /100 | #12 | Exceptional 11.3% |
| Immigrants | Lithuania | 99.9 /100 | #13 | Exceptional 11.3% |
| Lithuanians | 99.8 /100 | #14 | Exceptional 11.4% |
| Latvians | 99.8 /100 | #15 | Exceptional 11.4% |
Demographics Similar to Immigrants from Western Africa by Female Poverty
In terms of female poverty, the demographic groups most similar to Immigrants from Western Africa are Salvadoran (15.3%, a difference of 0.040%), Immigrants from Trinidad and Tobago (15.4%, a difference of 0.16%), Immigrants from Ghana (15.3%, a difference of 0.18%), Cuban (15.3%, a difference of 0.19%), and Potawatomi (15.3%, a difference of 0.19%).
| Demographics | Rating | Rank | Female Poverty |
| Nicaraguans | 0.3 /100 | #243 | Tragic 15.3% |
| Ecuadorians | 0.3 /100 | #244 | Tragic 15.3% |
| Spanish American Indians | 0.3 /100 | #245 | Tragic 15.3% |
| Cubans | 0.3 /100 | #246 | Tragic 15.3% |
| Potawatomi | 0.3 /100 | #247 | Tragic 15.3% |
| Immigrants | Ghana | 0.3 /100 | #248 | Tragic 15.3% |
| Salvadorans | 0.3 /100 | #249 | Tragic 15.3% |
| Immigrants | Western Africa | 0.3 /100 | #250 | Tragic 15.3% |
| Immigrants | Trinidad and Tobago | 0.3 /100 | #251 | Tragic 15.4% |
| Immigrants | Burma/Myanmar | 0.3 /100 | #252 | Tragic 15.4% |
| Liberians | 0.2 /100 | #253 | Tragic 15.4% |
| Trinidadians and Tobagonians | 0.2 /100 | #254 | Tragic 15.4% |
| Ottawa | 0.2 /100 | #255 | Tragic 15.5% |
| Jamaicans | 0.2 /100 | #256 | Tragic 15.5% |
| Immigrants | Jamaica | 0.1 /100 | #257 | Tragic 15.6% |