Immigrants from Hungary vs Panamanian Married-Couple Family Poverty
COMPARE
Immigrants from Hungary
Panamanian
Married-Couple Family Poverty
Married-Couple Family Poverty Comparison
Immigrants from Hungary
Panamanians
4.9%
MARRIED-COUPLE FAMILY POVERTY
88.7/ 100
METRIC RATING
136th/ 347
METRIC RANK
5.6%
MARRIED-COUPLE FAMILY POVERTY
9.2/ 100
METRIC RATING
221st/ 347
METRIC RANK
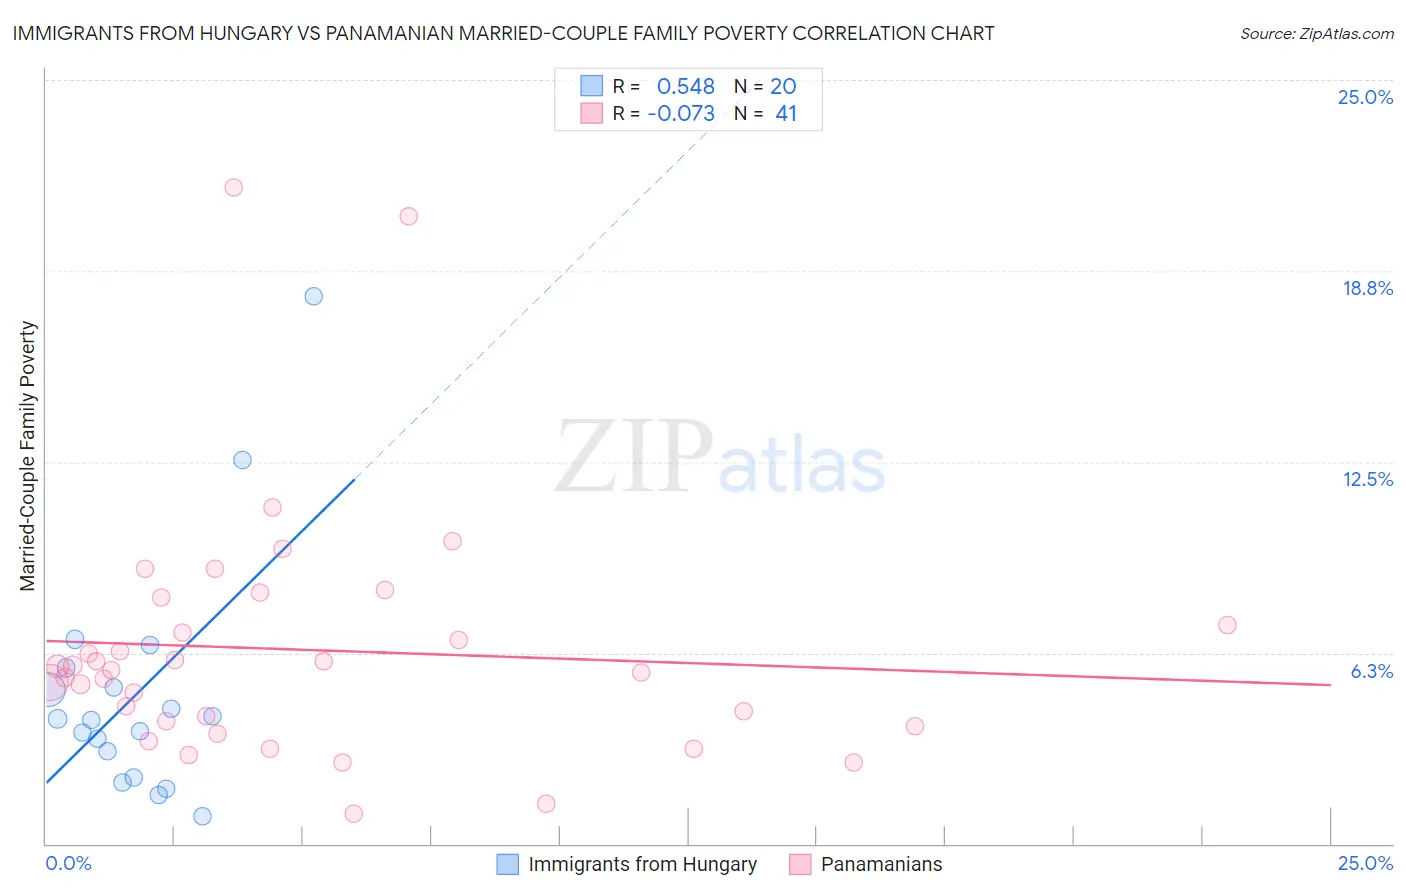
Immigrants from Hungary vs Panamanian Married-Couple Family Poverty Correlation Chart
The statistical analysis conducted on geographies consisting of 194,814,844 people shows a substantial positive correlation between the proportion of Immigrants from Hungary and poverty level among married-couple families in the United States with a correlation coefficient (R) of 0.548 and weighted average of 4.9%. Similarly, the statistical analysis conducted on geographies consisting of 279,759,434 people shows a slight negative correlation between the proportion of Panamanians and poverty level among married-couple families in the United States with a correlation coefficient (R) of -0.073 and weighted average of 5.6%, a difference of 13.5%.
Married-Couple Family Poverty Correlation Summary
| Measurement | Immigrants from Hungary | Panamanian |
| Minimum | 0.92% | 0.96% |
| Maximum | 17.9% | 21.5% |
| Range | 17.0% | 20.5% |
| Mean | 4.9% | 6.3% |
| Median | 4.1% | 5.7% |
| Interquartile 25% (IQ1) | 2.6% | 3.9% |
| Interquartile 75% (IQ3) | 5.4% | 7.6% |
| Interquartile Range (IQR) | 2.9% | 3.7% |
| Standard Deviation (Sample) | 4.0% | 4.1% |
| Standard Deviation (Population) | 3.9% | 4.0% |
Similar Demographics by Married-Couple Family Poverty
Demographics Similar to Immigrants from Hungary by Married-Couple Family Poverty
In terms of married-couple family poverty, the demographic groups most similar to Immigrants from Hungary are Assyrian/Chaldean/Syriac (4.9%, a difference of 0.22%), Samoan (4.9%, a difference of 0.50%), Immigrants from Kenya (4.9%, a difference of 0.51%), Puget Sound Salish (4.9%, a difference of 0.58%), and Immigrants from Eastern Europe (4.9%, a difference of 0.59%).
| Demographics | Rating | Rank | Married-Couple Family Poverty |
| Immigrants | Pakistan | 90.7 /100 | #129 | Exceptional 4.9% |
| Soviet Union | 90.7 /100 | #130 | Exceptional 4.9% |
| Immigrants | Eastern Europe | 90.5 /100 | #131 | Exceptional 4.9% |
| Puget Sound Salish | 90.4 /100 | #132 | Exceptional 4.9% |
| Immigrants | Kenya | 90.2 /100 | #133 | Exceptional 4.9% |
| Samoans | 90.2 /100 | #134 | Exceptional 4.9% |
| Assyrians/Chaldeans/Syriacs | 89.4 /100 | #135 | Excellent 4.9% |
| Immigrants | Hungary | 88.7 /100 | #136 | Excellent 4.9% |
| Guamanians/Chamorros | 86.5 /100 | #137 | Excellent 4.9% |
| Chileans | 86.0 /100 | #138 | Excellent 4.9% |
| German Russians | 85.1 /100 | #139 | Excellent 5.0% |
| Immigrants | Portugal | 84.8 /100 | #140 | Excellent 5.0% |
| Immigrants | Brazil | 84.6 /100 | #141 | Excellent 5.0% |
| Immigrants | China | 84.6 /100 | #142 | Excellent 5.0% |
| Immigrants | Egypt | 83.4 /100 | #143 | Excellent 5.0% |
Demographics Similar to Panamanians by Married-Couple Family Poverty
In terms of married-couple family poverty, the demographic groups most similar to Panamanians are Colombian (5.6%, a difference of 0.020%), Japanese (5.6%, a difference of 0.21%), Afghan (5.5%, a difference of 0.61%), Immigrants from Nigeria (5.5%, a difference of 0.63%), and Cajun (5.6%, a difference of 0.85%).
| Demographics | Rating | Rank | Married-Couple Family Poverty |
| Iroquois | 13.1 /100 | #214 | Poor 5.5% |
| Armenians | 12.8 /100 | #215 | Poor 5.5% |
| Potawatomi | 12.4 /100 | #216 | Poor 5.5% |
| Immigrants | Nigeria | 11.3 /100 | #217 | Poor 5.5% |
| Afghans | 11.2 /100 | #218 | Poor 5.5% |
| Japanese | 9.8 /100 | #219 | Tragic 5.6% |
| Colombians | 9.2 /100 | #220 | Tragic 5.6% |
| Panamanians | 9.2 /100 | #221 | Tragic 5.6% |
| Cajuns | 6.9 /100 | #222 | Tragic 5.6% |
| Immigrants | Fiji | 6.7 /100 | #223 | Tragic 5.6% |
| Sudanese | 6.4 /100 | #224 | Tragic 5.6% |
| Immigrants | Cambodia | 6.1 /100 | #225 | Tragic 5.6% |
| South Americans | 5.7 /100 | #226 | Tragic 5.6% |
| Immigrants | Zaire | 5.6 /100 | #227 | Tragic 5.6% |
| Arabs | 5.4 /100 | #228 | Tragic 5.7% |