Immigrants from Honduras vs Chippewa Female Poverty Among 25-34 Year Olds
COMPARE
Immigrants from Honduras
Chippewa
Female Poverty Among 25-34 Year Olds
Female Poverty Among 25-34 Year Olds Comparison
Immigrants from Honduras
Chippewa
17.3%
FEMALE POVERTY AMONG 25-34 YEAR OLDS
0.0/ 100
METRIC RATING
311th/ 347
METRIC RANK
18.0%
FEMALE POVERTY AMONG 25-34 YEAR OLDS
0.0/ 100
METRIC RATING
320th/ 347
METRIC RANK
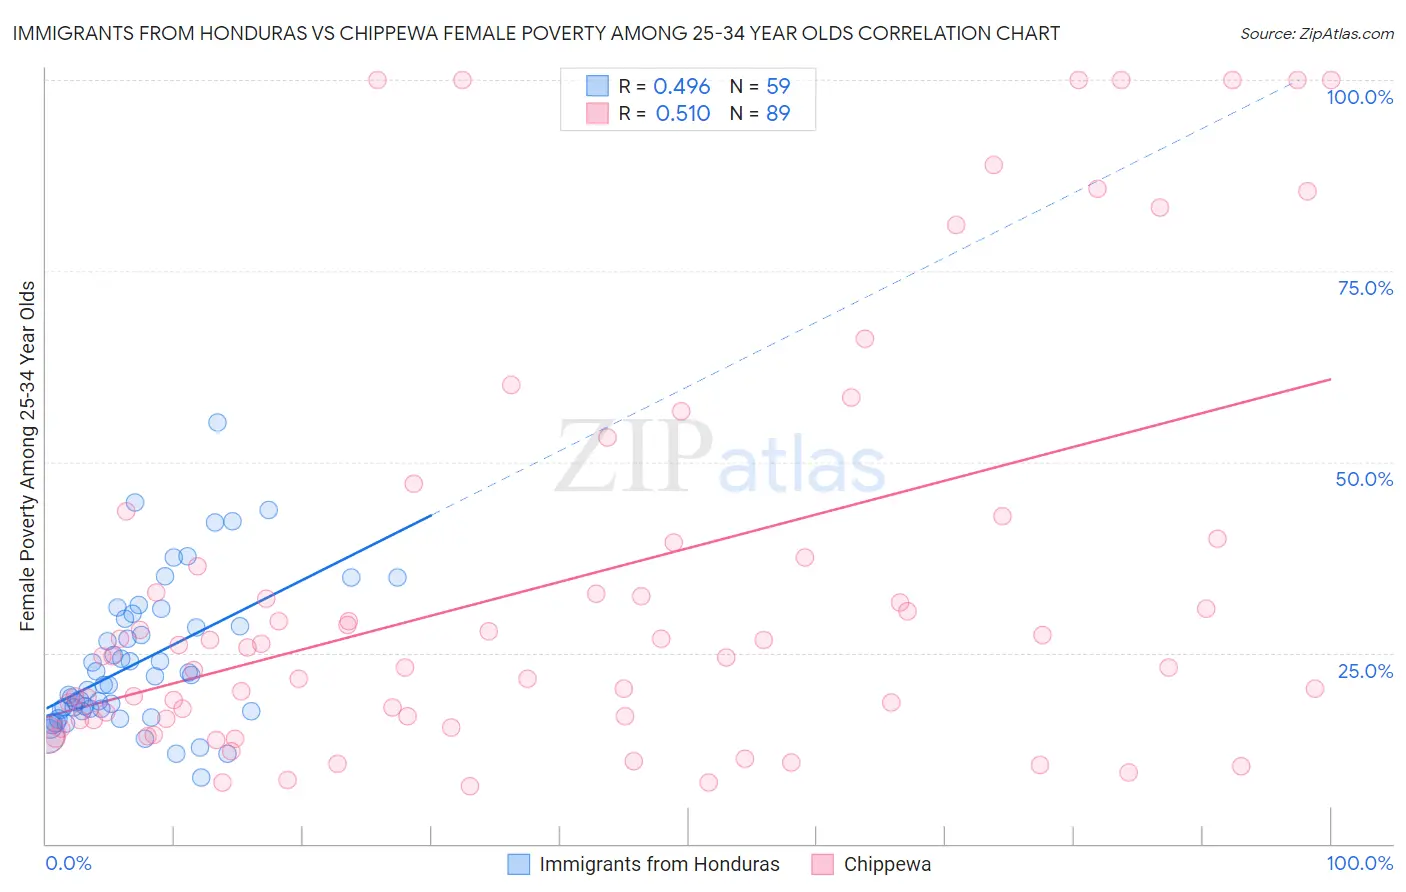
Immigrants from Honduras vs Chippewa Female Poverty Among 25-34 Year Olds Correlation Chart
The statistical analysis conducted on geographies consisting of 320,147,066 people shows a moderate positive correlation between the proportion of Immigrants from Honduras and poverty level among females between the ages 25 and 34 in the United States with a correlation coefficient (R) of 0.496 and weighted average of 17.3%. Similarly, the statistical analysis conducted on geographies consisting of 213,001,722 people shows a substantial positive correlation between the proportion of Chippewa and poverty level among females between the ages 25 and 34 in the United States with a correlation coefficient (R) of 0.510 and weighted average of 18.0%, a difference of 4.4%.
Female Poverty Among 25-34 Year Olds Correlation Summary
| Measurement | Immigrants from Honduras | Chippewa |
| Minimum | 8.6% | 7.5% |
| Maximum | 55.1% | 100.0% |
| Range | 46.5% | 92.5% |
| Mean | 23.9% | 33.8% |
| Median | 20.8% | 24.5% |
| Interquartile 25% (IQ1) | 17.3% | 16.3% |
| Interquartile 75% (IQ3) | 29.5% | 38.5% |
| Interquartile Range (IQR) | 12.2% | 22.2% |
| Standard Deviation (Sample) | 9.6% | 26.8% |
| Standard Deviation (Population) | 9.5% | 26.6% |
Demographics Similar to Immigrants from Honduras and Chippewa by Female Poverty Among 25-34 Year Olds
In terms of female poverty among 25-34 year olds, the demographic groups most similar to Immigrants from Honduras are Cherokee (17.2%, a difference of 0.48%), Ottawa (17.1%, a difference of 0.95%), Iroquois (17.5%, a difference of 1.1%), Colville (17.5%, a difference of 1.2%), and African (17.0%, a difference of 1.3%). Similarly, the demographic groups most similar to Chippewa are Choctaw (18.1%, a difference of 0.22%), Menominee (18.0%, a difference of 0.26%), Ute (17.9%, a difference of 0.81%), Central American Indian (18.2%, a difference of 1.1%), and Seminole (18.3%, a difference of 1.4%).
| Demographics | Rating | Rank | Female Poverty Among 25-34 Year Olds |
| Immigrants | Cabo Verde | 0.0 /100 | #305 | Tragic 16.9% |
| Chickasaw | 0.0 /100 | #306 | Tragic 17.0% |
| Yaqui | 0.0 /100 | #307 | Tragic 17.0% |
| Africans | 0.0 /100 | #308 | Tragic 17.0% |
| Ottawa | 0.0 /100 | #309 | Tragic 17.1% |
| Cherokee | 0.0 /100 | #310 | Tragic 17.2% |
| Immigrants | Honduras | 0.0 /100 | #311 | Tragic 17.3% |
| Iroquois | 0.0 /100 | #312 | Tragic 17.5% |
| Colville | 0.0 /100 | #313 | Tragic 17.5% |
| Immigrants | Dominican Republic | 0.0 /100 | #314 | Tragic 17.6% |
| Yakama | 0.0 /100 | #315 | Tragic 17.6% |
| Dominicans | 0.0 /100 | #316 | Tragic 17.6% |
| Arapaho | 0.0 /100 | #317 | Tragic 17.8% |
| Ute | 0.0 /100 | #318 | Tragic 17.9% |
| Menominee | 0.0 /100 | #319 | Tragic 18.0% |
| Chippewa | 0.0 /100 | #320 | Tragic 18.0% |
| Choctaw | 0.0 /100 | #321 | Tragic 18.1% |
| Central American Indians | 0.0 /100 | #322 | Tragic 18.2% |
| Seminole | 0.0 /100 | #323 | Tragic 18.3% |
| Dutch West Indians | 0.0 /100 | #324 | Tragic 18.4% |
| Inupiat | 0.0 /100 | #325 | Tragic 18.5% |