Immigrants from Bulgaria vs Chippewa Female Poverty Among 25-34 Year Olds
COMPARE
Immigrants from Bulgaria
Chippewa
Female Poverty Among 25-34 Year Olds
Female Poverty Among 25-34 Year Olds Comparison
Immigrants from Bulgaria
Chippewa
11.8%
FEMALE POVERTY AMONG 25-34 YEAR OLDS
99.8/ 100
METRIC RATING
40th/ 347
METRIC RANK
18.0%
FEMALE POVERTY AMONG 25-34 YEAR OLDS
0.0/ 100
METRIC RATING
320th/ 347
METRIC RANK
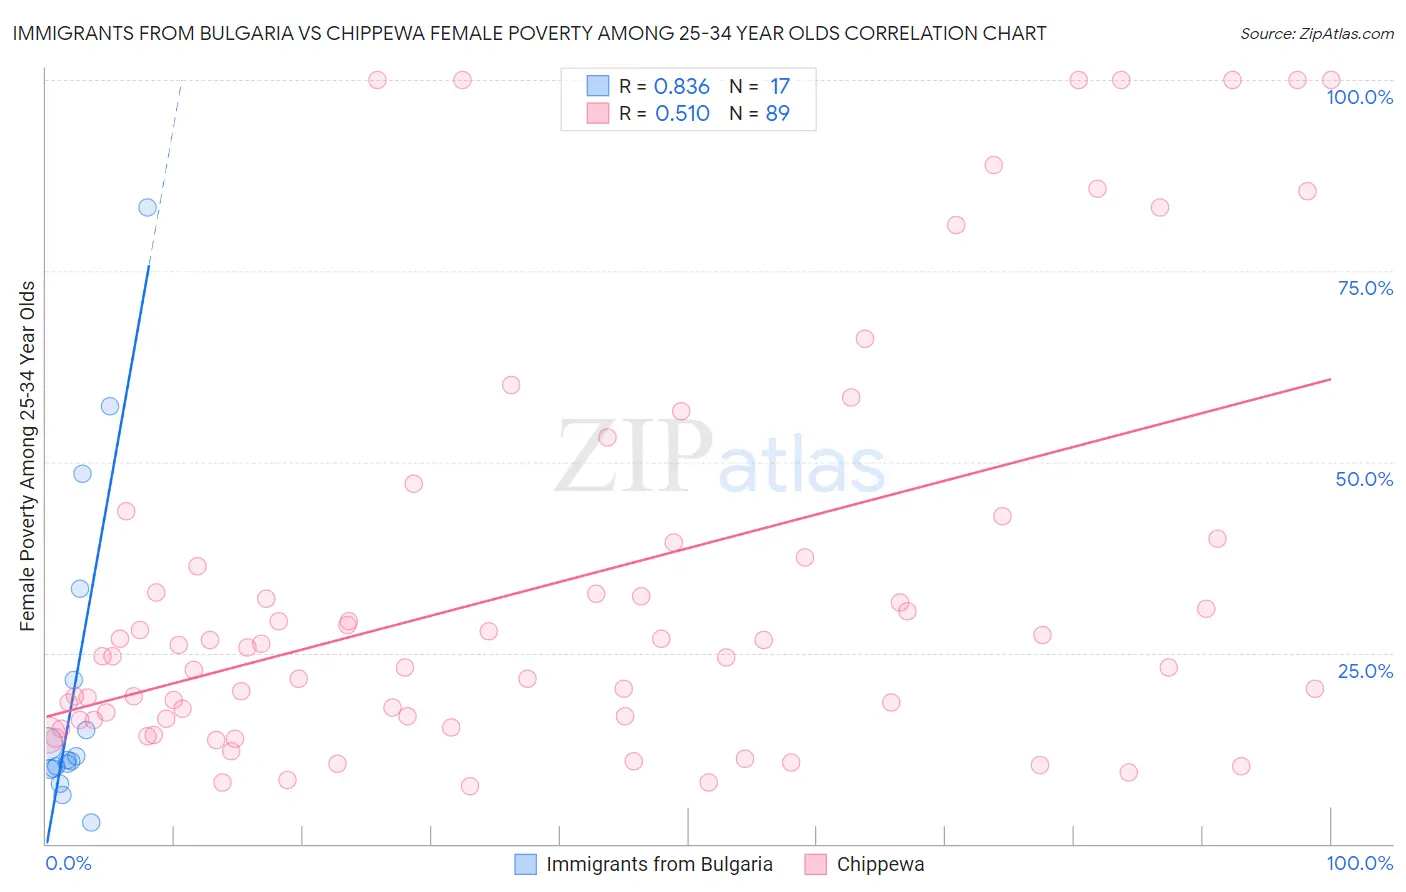
Immigrants from Bulgaria vs Chippewa Female Poverty Among 25-34 Year Olds Correlation Chart
The statistical analysis conducted on geographies consisting of 171,069,658 people shows a very strong positive correlation between the proportion of Immigrants from Bulgaria and poverty level among females between the ages 25 and 34 in the United States with a correlation coefficient (R) of 0.836 and weighted average of 11.8%. Similarly, the statistical analysis conducted on geographies consisting of 213,001,722 people shows a substantial positive correlation between the proportion of Chippewa and poverty level among females between the ages 25 and 34 in the United States with a correlation coefficient (R) of 0.510 and weighted average of 18.0%, a difference of 52.3%.
Female Poverty Among 25-34 Year Olds Correlation Summary
| Measurement | Immigrants from Bulgaria | Chippewa |
| Minimum | 2.9% | 7.5% |
| Maximum | 83.3% | 100.0% |
| Range | 80.5% | 92.5% |
| Mean | 21.3% | 33.8% |
| Median | 11.0% | 24.5% |
| Interquartile 25% (IQ1) | 9.8% | 16.3% |
| Interquartile 75% (IQ3) | 27.4% | 38.5% |
| Interquartile Range (IQR) | 17.6% | 22.2% |
| Standard Deviation (Sample) | 21.9% | 26.8% |
| Standard Deviation (Population) | 21.3% | 26.6% |
Similar Demographics by Female Poverty Among 25-34 Year Olds
Demographics Similar to Immigrants from Bulgaria by Female Poverty Among 25-34 Year Olds
In terms of female poverty among 25-34 year olds, the demographic groups most similar to Immigrants from Bulgaria are Immigrants from Indonesia (11.8%, a difference of 0.13%), Latvian (11.8%, a difference of 0.16%), Immigrants from North Macedonia (11.8%, a difference of 0.41%), Immigrants from Turkey (11.9%, a difference of 0.42%), and Taiwanese (11.8%, a difference of 0.48%).
| Demographics | Rating | Rank | Female Poverty Among 25-34 Year Olds |
| Immigrants | Poland | 99.9 /100 | #33 | Exceptional 11.6% |
| Zimbabweans | 99.9 /100 | #34 | Exceptional 11.7% |
| Cambodians | 99.9 /100 | #35 | Exceptional 11.7% |
| Immigrants | Sri Lanka | 99.8 /100 | #36 | Exceptional 11.8% |
| Taiwanese | 99.8 /100 | #37 | Exceptional 11.8% |
| Immigrants | North Macedonia | 99.8 /100 | #38 | Exceptional 11.8% |
| Latvians | 99.8 /100 | #39 | Exceptional 11.8% |
| Immigrants | Bulgaria | 99.8 /100 | #40 | Exceptional 11.8% |
| Immigrants | Indonesia | 99.8 /100 | #41 | Exceptional 11.8% |
| Immigrants | Turkey | 99.7 /100 | #42 | Exceptional 11.9% |
| Egyptians | 99.7 /100 | #43 | Exceptional 11.9% |
| Immigrants | Australia | 99.7 /100 | #44 | Exceptional 11.9% |
| Macedonians | 99.7 /100 | #45 | Exceptional 11.9% |
| Immigrants | Serbia | 99.7 /100 | #46 | Exceptional 11.9% |
| Koreans | 99.6 /100 | #47 | Exceptional 12.0% |
Demographics Similar to Chippewa by Female Poverty Among 25-34 Year Olds
In terms of female poverty among 25-34 year olds, the demographic groups most similar to Chippewa are Choctaw (18.1%, a difference of 0.22%), Menominee (18.0%, a difference of 0.26%), Ute (17.9%, a difference of 0.81%), Central American Indian (18.2%, a difference of 1.1%), and Seminole (18.3%, a difference of 1.4%).
| Demographics | Rating | Rank | Female Poverty Among 25-34 Year Olds |
| Colville | 0.0 /100 | #313 | Tragic 17.5% |
| Immigrants | Dominican Republic | 0.0 /100 | #314 | Tragic 17.6% |
| Yakama | 0.0 /100 | #315 | Tragic 17.6% |
| Dominicans | 0.0 /100 | #316 | Tragic 17.6% |
| Arapaho | 0.0 /100 | #317 | Tragic 17.8% |
| Ute | 0.0 /100 | #318 | Tragic 17.9% |
| Menominee | 0.0 /100 | #319 | Tragic 18.0% |
| Chippewa | 0.0 /100 | #320 | Tragic 18.0% |
| Choctaw | 0.0 /100 | #321 | Tragic 18.1% |
| Central American Indians | 0.0 /100 | #322 | Tragic 18.2% |
| Seminole | 0.0 /100 | #323 | Tragic 18.3% |
| Dutch West Indians | 0.0 /100 | #324 | Tragic 18.4% |
| Inupiat | 0.0 /100 | #325 | Tragic 18.5% |
| Blacks/African Americans | 0.0 /100 | #326 | Tragic 18.9% |
| Cheyenne | 0.0 /100 | #327 | Tragic 19.1% |