Immigrants from Honduras vs Comanche Female Poverty Among 25-34 Year Olds
COMPARE
Immigrants from Honduras
Comanche
Female Poverty Among 25-34 Year Olds
Female Poverty Among 25-34 Year Olds Comparison
Immigrants from Honduras
Comanche
17.3%
FEMALE POVERTY AMONG 25-34 YEAR OLDS
0.0/ 100
METRIC RATING
311th/ 347
METRIC RANK
16.5%
FEMALE POVERTY AMONG 25-34 YEAR OLDS
0.0/ 100
METRIC RATING
291st/ 347
METRIC RANK
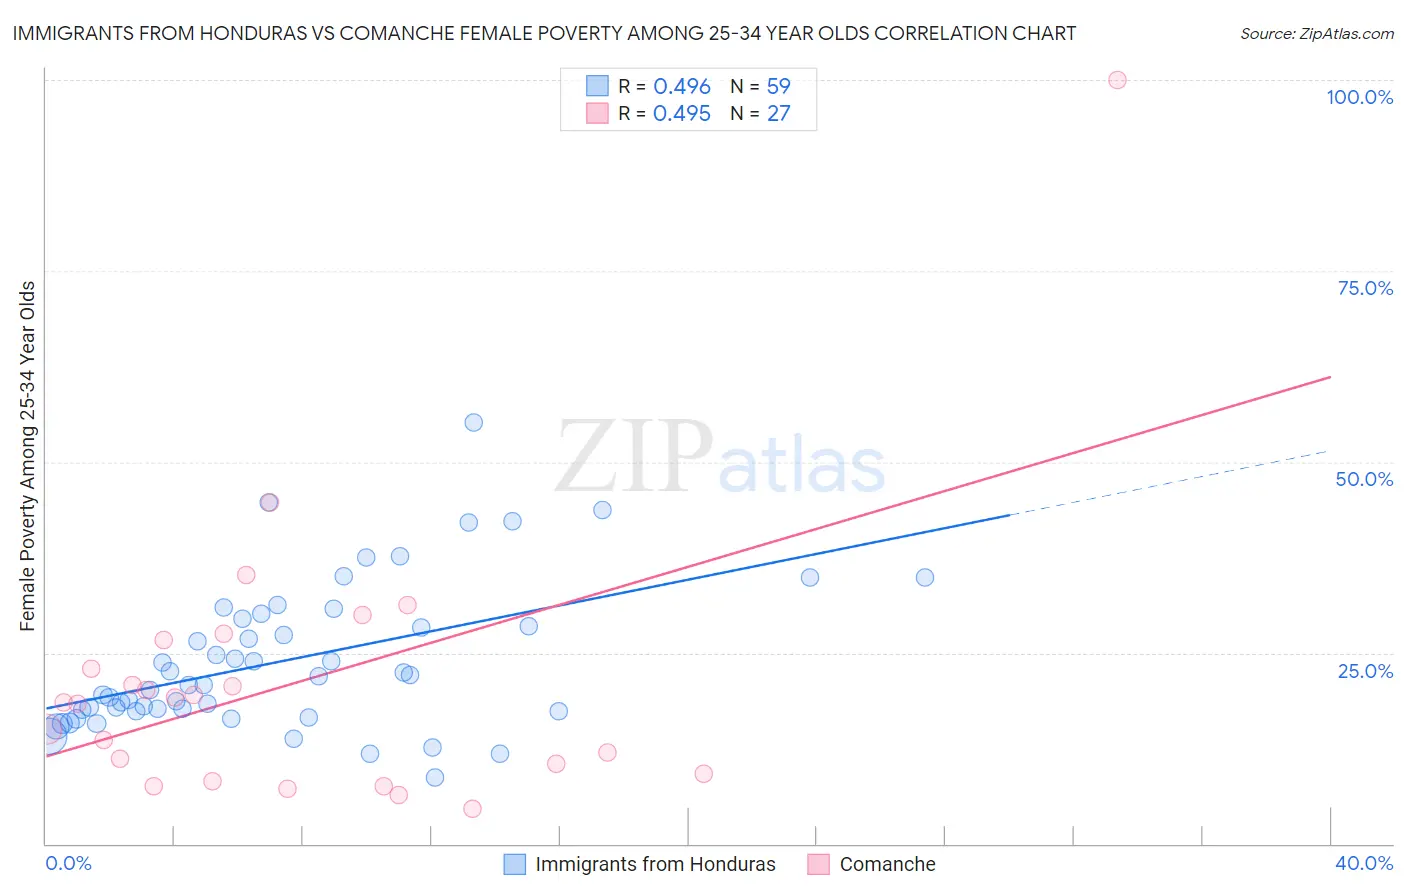
Immigrants from Honduras vs Comanche Female Poverty Among 25-34 Year Olds Correlation Chart
The statistical analysis conducted on geographies consisting of 320,147,066 people shows a moderate positive correlation between the proportion of Immigrants from Honduras and poverty level among females between the ages 25 and 34 in the United States with a correlation coefficient (R) of 0.496 and weighted average of 17.3%. Similarly, the statistical analysis conducted on geographies consisting of 109,487,317 people shows a moderate positive correlation between the proportion of Comanche and poverty level among females between the ages 25 and 34 in the United States with a correlation coefficient (R) of 0.495 and weighted average of 16.5%, a difference of 4.8%.
Female Poverty Among 25-34 Year Olds Correlation Summary
| Measurement | Immigrants from Honduras | Comanche |
| Minimum | 8.6% | 4.5% |
| Maximum | 55.1% | 100.0% |
| Range | 46.5% | 95.5% |
| Mean | 23.9% | 21.0% |
| Median | 20.8% | 18.5% |
| Interquartile 25% (IQ1) | 17.3% | 9.1% |
| Interquartile 75% (IQ3) | 29.5% | 26.7% |
| Interquartile Range (IQR) | 12.2% | 17.6% |
| Standard Deviation (Sample) | 9.6% | 18.6% |
| Standard Deviation (Population) | 9.5% | 18.3% |
Demographics Similar to Immigrants from Honduras and Comanche by Female Poverty Among 25-34 Year Olds
In terms of female poverty among 25-34 year olds, the demographic groups most similar to Immigrants from Honduras are Cherokee (17.2%, a difference of 0.48%), Ottawa (17.1%, a difference of 0.95%), African (17.0%, a difference of 1.3%), Yaqui (17.0%, a difference of 1.5%), and Chickasaw (17.0%, a difference of 1.5%). Similarly, the demographic groups most similar to Comanche are Immigrants from Dominica (16.5%, a difference of 0.010%), Potawatomi (16.5%, a difference of 0.28%), Immigrants from Central America (16.6%, a difference of 0.64%), Mexican (16.6%, a difference of 0.72%), and Hispanic or Latino (16.6%, a difference of 0.92%).
| Demographics | Rating | Rank | Female Poverty Among 25-34 Year Olds |
| Comanche | 0.0 /100 | #291 | Tragic 16.5% |
| Immigrants | Dominica | 0.0 /100 | #292 | Tragic 16.5% |
| Potawatomi | 0.0 /100 | #293 | Tragic 16.5% |
| Immigrants | Central America | 0.0 /100 | #294 | Tragic 16.6% |
| Mexicans | 0.0 /100 | #295 | Tragic 16.6% |
| Hispanics or Latinos | 0.0 /100 | #296 | Tragic 16.6% |
| Immigrants | Guatemala | 0.0 /100 | #297 | Tragic 16.6% |
| Blackfeet | 0.0 /100 | #298 | Tragic 16.7% |
| Spanish Americans | 0.0 /100 | #299 | Tragic 16.7% |
| U.S. Virgin Islanders | 0.0 /100 | #300 | Tragic 16.7% |
| Immigrants | Congo | 0.0 /100 | #301 | Tragic 16.7% |
| Alaska Natives | 0.0 /100 | #302 | Tragic 16.8% |
| Immigrants | Mexico | 0.0 /100 | #303 | Tragic 16.8% |
| Hondurans | 0.0 /100 | #304 | Tragic 16.9% |
| Immigrants | Cabo Verde | 0.0 /100 | #305 | Tragic 16.9% |
| Chickasaw | 0.0 /100 | #306 | Tragic 17.0% |
| Yaqui | 0.0 /100 | #307 | Tragic 17.0% |
| Africans | 0.0 /100 | #308 | Tragic 17.0% |
| Ottawa | 0.0 /100 | #309 | Tragic 17.1% |
| Cherokee | 0.0 /100 | #310 | Tragic 17.2% |
| Immigrants | Honduras | 0.0 /100 | #311 | Tragic 17.3% |