Immigrants from Honduras vs Chippewa In Labor Force | Age 30-34
COMPARE
Immigrants from Honduras
Chippewa
In Labor Force | Age 30-34
In Labor Force | Age 30-34 Comparison
Immigrants from Honduras
Chippewa
83.7%
IN LABOR FORCE | AGE 30-34
0.1/ 100
METRIC RATING
265th/ 347
METRIC RANK
82.6%
IN LABOR FORCE | AGE 30-34
0.0/ 100
METRIC RATING
296th/ 347
METRIC RANK
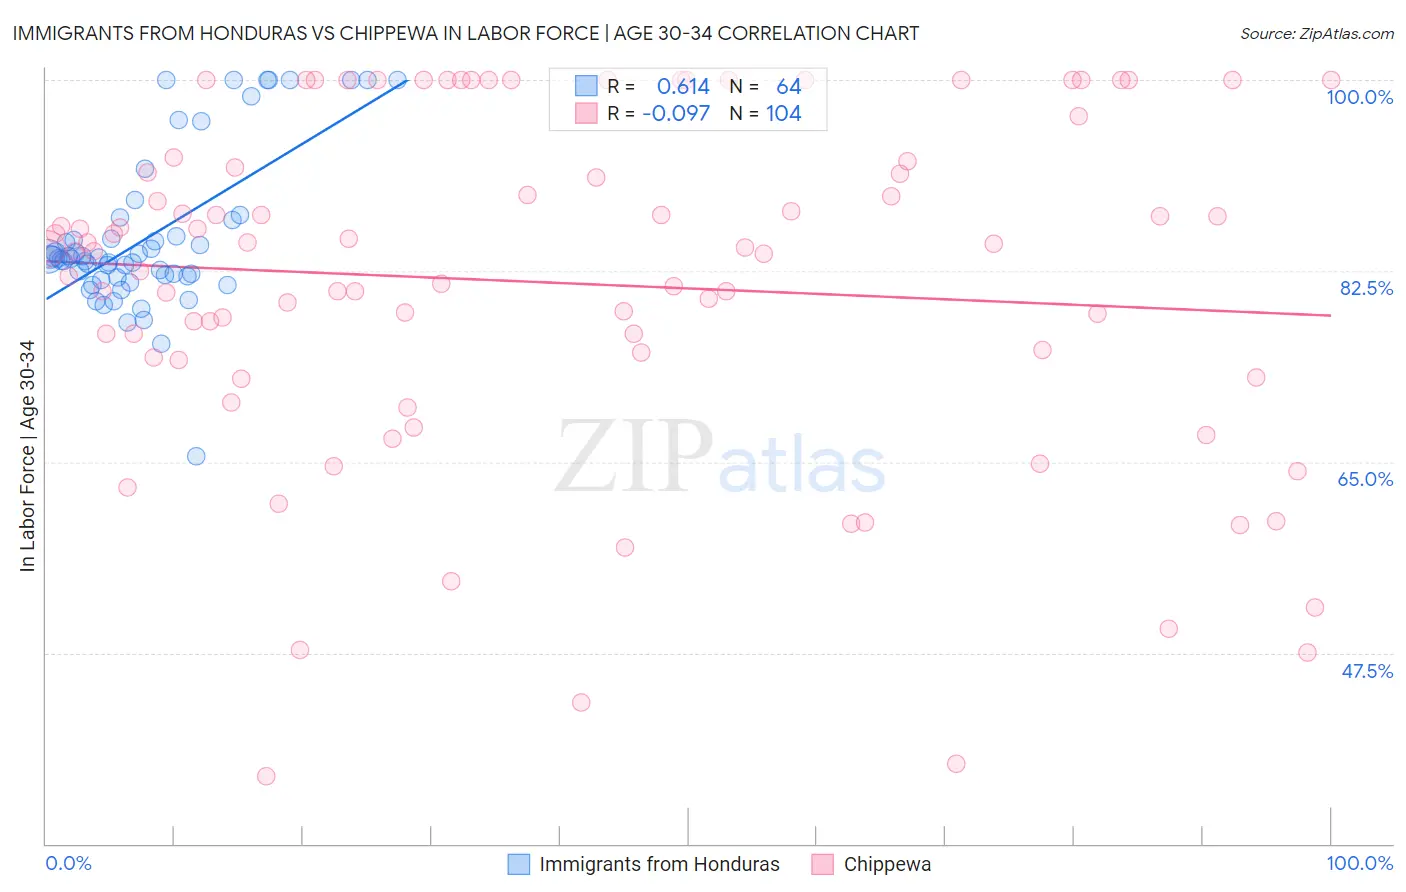
Immigrants from Honduras vs Chippewa In Labor Force | Age 30-34 Correlation Chart
The statistical analysis conducted on geographies consisting of 322,455,880 people shows a significant positive correlation between the proportion of Immigrants from Honduras and labor force participation rate among population between the ages 30 and 34 in the United States with a correlation coefficient (R) of 0.614 and weighted average of 83.7%. Similarly, the statistical analysis conducted on geographies consisting of 214,981,343 people shows a slight negative correlation between the proportion of Chippewa and labor force participation rate among population between the ages 30 and 34 in the United States with a correlation coefficient (R) of -0.097 and weighted average of 82.6%, a difference of 1.4%.
In Labor Force | Age 30-34 Correlation Summary
| Measurement | Immigrants from Honduras | Chippewa |
| Minimum | 65.5% | 36.2% |
| Maximum | 100.0% | 100.0% |
| Range | 34.5% | 63.8% |
| Mean | 85.6% | 81.4% |
| Median | 83.7% | 84.4% |
| Interquartile 25% (IQ1) | 81.9% | 74.4% |
| Interquartile 75% (IQ3) | 86.4% | 92.2% |
| Interquartile Range (IQR) | 4.5% | 17.8% |
| Standard Deviation (Sample) | 7.1% | 15.7% |
| Standard Deviation (Population) | 7.1% | 15.6% |
Similar Demographics by In Labor Force | Age 30-34
Demographics Similar to Immigrants from Honduras by In Labor Force | Age 30-34
In terms of in labor force | age 30-34, the demographic groups most similar to Immigrants from Honduras are Immigrants from Guatemala (83.7%, a difference of 0.020%), Guatemalan (83.7%, a difference of 0.030%), Dominican (83.8%, a difference of 0.080%), Immigrants from Guyana (83.8%, a difference of 0.080%), and Guyanese (83.8%, a difference of 0.10%).
| Demographics | Rating | Rank | In Labor Force | Age 30-34 |
| Hondurans | 0.3 /100 | #258 | Tragic 83.8% |
| Scotch-Irish | 0.3 /100 | #259 | Tragic 83.8% |
| Immigrants | Dominican Republic | 0.3 /100 | #260 | Tragic 83.8% |
| Guyanese | 0.3 /100 | #261 | Tragic 83.8% |
| Dominicans | 0.2 /100 | #262 | Tragic 83.8% |
| Immigrants | Guyana | 0.2 /100 | #263 | Tragic 83.8% |
| Guatemalans | 0.2 /100 | #264 | Tragic 83.7% |
| Immigrants | Honduras | 0.1 /100 | #265 | Tragic 83.7% |
| Immigrants | Guatemala | 0.1 /100 | #266 | Tragic 83.7% |
| Spaniards | 0.1 /100 | #267 | Tragic 83.6% |
| Immigrants | Bangladesh | 0.1 /100 | #268 | Tragic 83.6% |
| Vietnamese | 0.1 /100 | #269 | Tragic 83.6% |
| Spanish Americans | 0.0 /100 | #270 | Tragic 83.5% |
| Spanish | 0.0 /100 | #271 | Tragic 83.5% |
| Immigrants | Nonimmigrants | 0.0 /100 | #272 | Tragic 83.5% |
Demographics Similar to Chippewa by In Labor Force | Age 30-34
In terms of in labor force | age 30-34, the demographic groups most similar to Chippewa are Comanche (82.6%, a difference of 0.010%), Aleut (82.6%, a difference of 0.010%), Pennsylvania German (82.6%, a difference of 0.020%), American (82.7%, a difference of 0.14%), and Immigrants from Central America (82.5%, a difference of 0.14%).
| Demographics | Rating | Rank | In Labor Force | Age 30-34 |
| Hawaiians | 0.0 /100 | #289 | Tragic 83.0% |
| Blackfeet | 0.0 /100 | #290 | Tragic 82.8% |
| Potawatomi | 0.0 /100 | #291 | Tragic 82.8% |
| Blacks/African Americans | 0.0 /100 | #292 | Tragic 82.8% |
| Nepalese | 0.0 /100 | #293 | Tragic 82.7% |
| Americans | 0.0 /100 | #294 | Tragic 82.7% |
| Pennsylvania Germans | 0.0 /100 | #295 | Tragic 82.6% |
| Chippewa | 0.0 /100 | #296 | Tragic 82.6% |
| Comanche | 0.0 /100 | #297 | Tragic 82.6% |
| Aleuts | 0.0 /100 | #298 | Tragic 82.6% |
| Immigrants | Central America | 0.0 /100 | #299 | Tragic 82.5% |
| Hmong | 0.0 /100 | #300 | Tragic 82.4% |
| Hispanics or Latinos | 0.0 /100 | #301 | Tragic 82.4% |
| Ottawa | 0.0 /100 | #302 | Tragic 82.4% |
| Immigrants | Micronesia | 0.0 /100 | #303 | Tragic 82.4% |