Immigrants from Honduras vs Chippewa Median Family Income
COMPARE
Immigrants from Honduras
Chippewa
Median Family Income
Median Family Income Comparison
Immigrants from Honduras
Chippewa
$83,618
MEDIAN FAMILY INCOME
0.0/ 100
METRIC RATING
319th/ 347
METRIC RANK
$86,852
MEDIAN FAMILY INCOME
0.0/ 100
METRIC RATING
299th/ 347
METRIC RANK
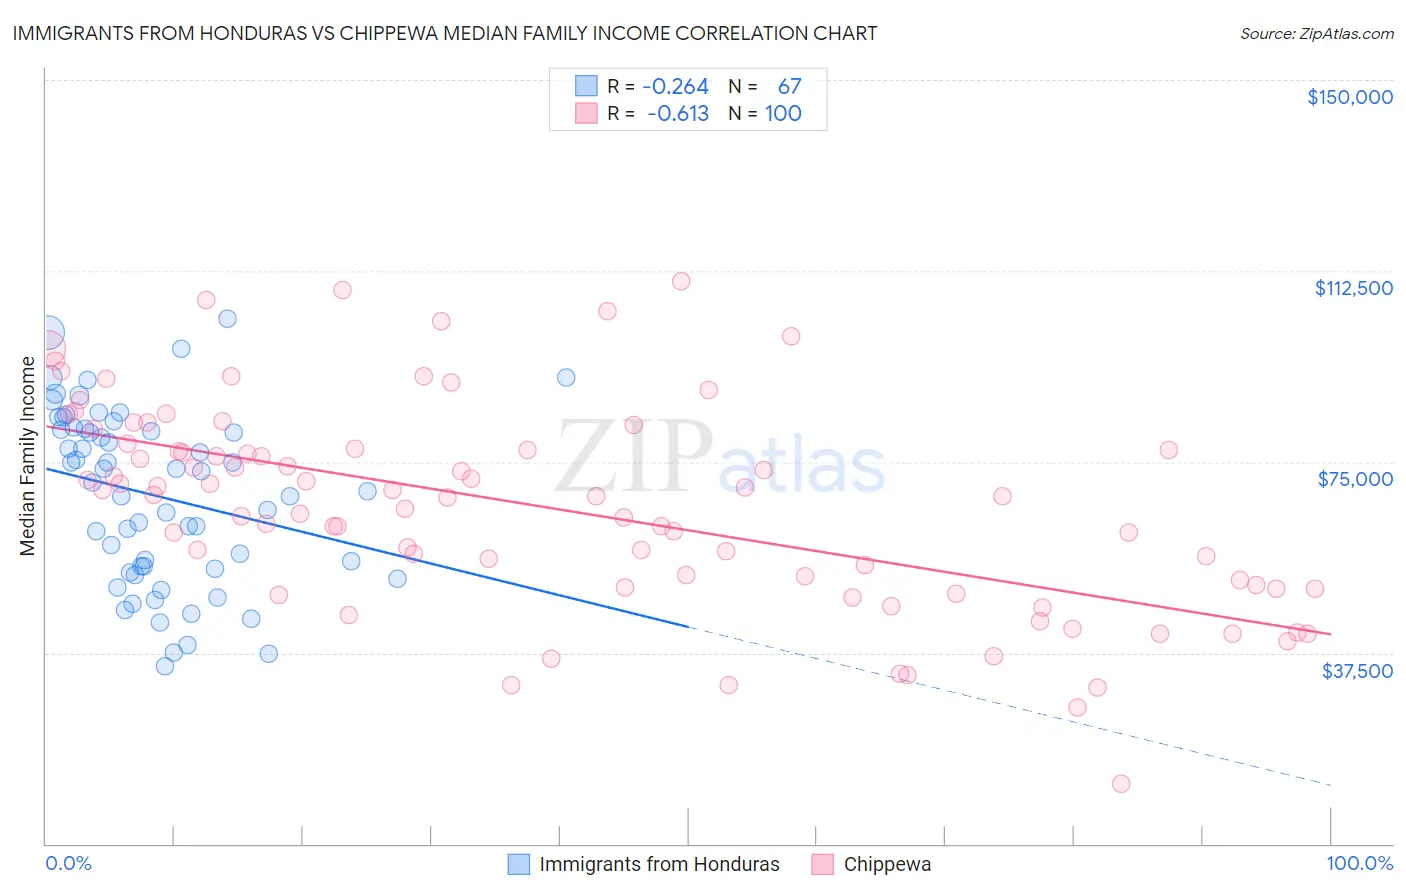
Immigrants from Honduras vs Chippewa Median Family Income Correlation Chart
The statistical analysis conducted on geographies consisting of 322,401,068 people shows a weak negative correlation between the proportion of Immigrants from Honduras and median family income in the United States with a correlation coefficient (R) of -0.264 and weighted average of $83,618. Similarly, the statistical analysis conducted on geographies consisting of 214,970,726 people shows a significant negative correlation between the proportion of Chippewa and median family income in the United States with a correlation coefficient (R) of -0.613 and weighted average of $86,852, a difference of 3.9%.
Median Family Income Correlation Summary
| Measurement | Immigrants from Honduras | Chippewa |
| Minimum | $34,952 | $11,667 |
| Maximum | $103,059 | $110,455 |
| Range | $68,107 | $98,788 |
| Mean | $68,333 | $65,965 |
| Median | $70,983 | $68,273 |
| Interquartile 25% (IQ1) | $53,890 | $50,598 |
| Interquartile 75% (IQ3) | $81,453 | $77,379 |
| Interquartile Range (IQR) | $27,563 | $26,781 |
| Standard Deviation (Sample) | $17,040 | $20,173 |
| Standard Deviation (Population) | $16,912 | $20,072 |
Demographics Similar to Immigrants from Honduras and Chippewa by Median Family Income
In terms of median family income, the demographic groups most similar to Immigrants from Honduras are Immigrants from Mexico ($83,639, a difference of 0.030%), Yakama ($83,932, a difference of 0.38%), Immigrants from Haiti ($84,018, a difference of 0.48%), Apache ($84,451, a difference of 1.0%), and Immigrants from Bahamas ($84,732, a difference of 1.3%). Similarly, the demographic groups most similar to Chippewa are Ottawa ($86,380, a difference of 0.55%), Colville ($85,792, a difference of 1.2%), Spanish American Indian ($85,728, a difference of 1.3%), Hispanic or Latino ($85,647, a difference of 1.4%), and Mexican ($85,618, a difference of 1.4%).
| Demographics | Rating | Rank | Median Family Income |
| Chippewa | 0.0 /100 | #299 | Tragic $86,852 |
| Ottawa | 0.0 /100 | #300 | Tragic $86,380 |
| Colville | 0.0 /100 | #301 | Tragic $85,792 |
| Spanish American Indians | 0.0 /100 | #302 | Tragic $85,728 |
| Hispanics or Latinos | 0.0 /100 | #303 | Tragic $85,647 |
| Mexicans | 0.0 /100 | #304 | Tragic $85,618 |
| Paiute | 0.0 /100 | #305 | Tragic $85,414 |
| Immigrants | Dominica | 0.0 /100 | #306 | Tragic $85,411 |
| Chickasaw | 0.0 /100 | #307 | Tragic $85,356 |
| U.S. Virgin Islanders | 0.0 /100 | #308 | Tragic $85,294 |
| Haitians | 0.0 /100 | #309 | Tragic $85,218 |
| Immigrants | Central America | 0.0 /100 | #310 | Tragic $85,050 |
| Hondurans | 0.0 /100 | #311 | Tragic $85,004 |
| Cubans | 0.0 /100 | #312 | Tragic $84,981 |
| Choctaw | 0.0 /100 | #313 | Tragic $84,835 |
| Immigrants | Bahamas | 0.0 /100 | #314 | Tragic $84,732 |
| Apache | 0.0 /100 | #315 | Tragic $84,451 |
| Immigrants | Haiti | 0.0 /100 | #316 | Tragic $84,018 |
| Yakama | 0.0 /100 | #317 | Tragic $83,932 |
| Immigrants | Mexico | 0.0 /100 | #318 | Tragic $83,639 |
| Immigrants | Honduras | 0.0 /100 | #319 | Tragic $83,618 |