Armenian vs Chippewa Female Poverty Among 25-34 Year Olds
COMPARE
Armenian
Chippewa
Female Poverty Among 25-34 Year Olds
Female Poverty Among 25-34 Year Olds Comparison
Armenians
Chippewa
12.2%
FEMALE POVERTY AMONG 25-34 YEAR OLDS
99.2/ 100
METRIC RATING
65th/ 347
METRIC RANK
18.0%
FEMALE POVERTY AMONG 25-34 YEAR OLDS
0.0/ 100
METRIC RATING
320th/ 347
METRIC RANK
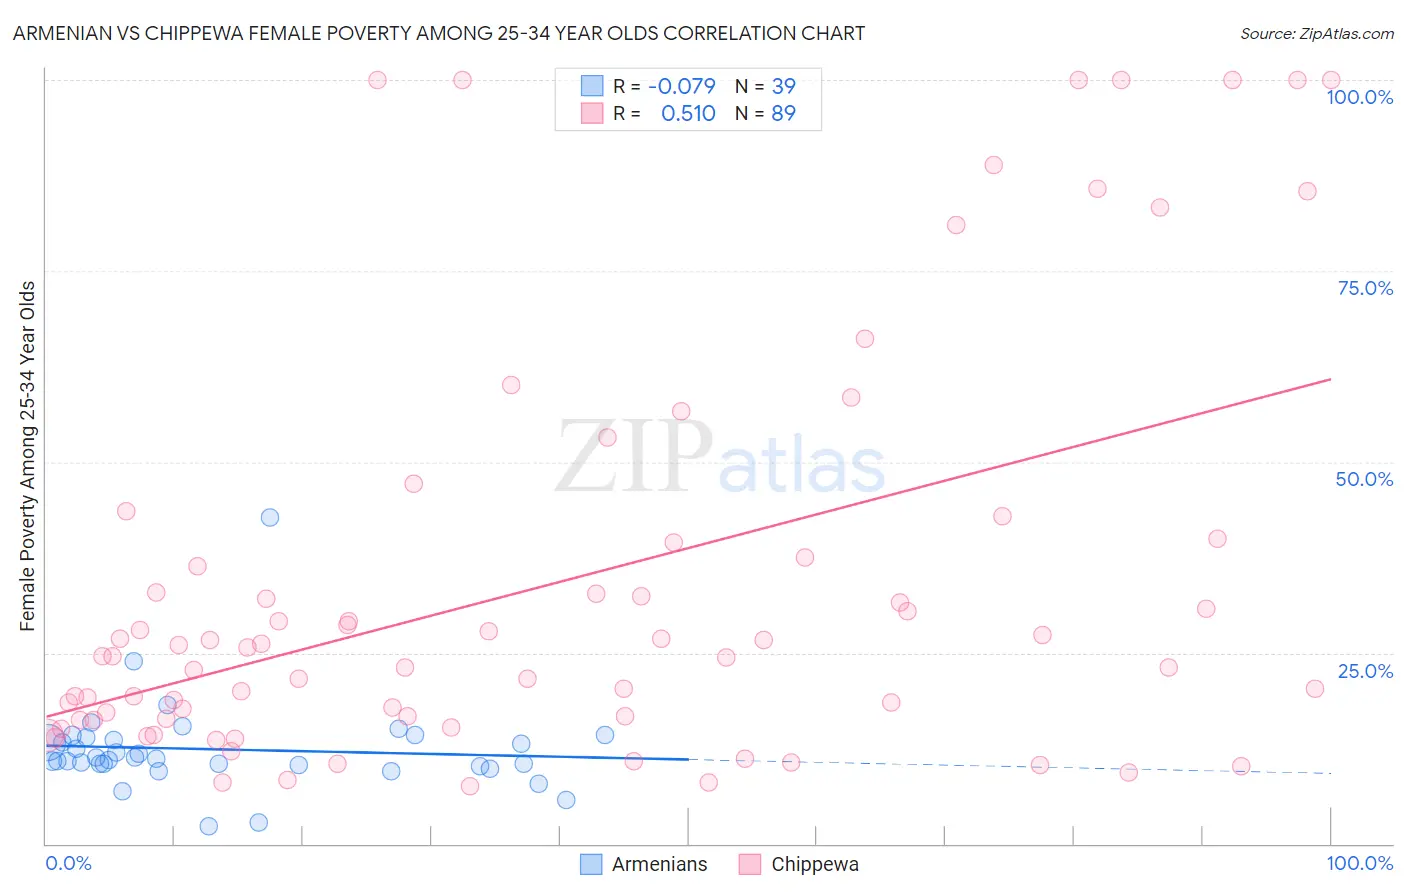
Armenian vs Chippewa Female Poverty Among 25-34 Year Olds Correlation Chart
The statistical analysis conducted on geographies consisting of 305,860,735 people shows a slight negative correlation between the proportion of Armenians and poverty level among females between the ages 25 and 34 in the United States with a correlation coefficient (R) of -0.079 and weighted average of 12.2%. Similarly, the statistical analysis conducted on geographies consisting of 213,001,722 people shows a substantial positive correlation between the proportion of Chippewa and poverty level among females between the ages 25 and 34 in the United States with a correlation coefficient (R) of 0.510 and weighted average of 18.0%, a difference of 48.1%.
Female Poverty Among 25-34 Year Olds Correlation Summary
| Measurement | Armenian | Chippewa |
| Minimum | 2.2% | 7.5% |
| Maximum | 42.7% | 100.0% |
| Range | 40.4% | 92.5% |
| Mean | 12.3% | 33.8% |
| Median | 11.1% | 24.5% |
| Interquartile 25% (IQ1) | 10.3% | 16.3% |
| Interquartile 75% (IQ3) | 13.8% | 38.5% |
| Interquartile Range (IQR) | 3.6% | 22.2% |
| Standard Deviation (Sample) | 6.2% | 26.8% |
| Standard Deviation (Population) | 6.2% | 26.6% |
Similar Demographics by Female Poverty Among 25-34 Year Olds
Demographics Similar to Armenians by Female Poverty Among 25-34 Year Olds
In terms of female poverty among 25-34 year olds, the demographic groups most similar to Armenians are Immigrants from Russia (12.2%, a difference of 0.020%), Immigrants from Europe (12.2%, a difference of 0.060%), Laotian (12.2%, a difference of 0.17%), Soviet Union (12.1%, a difference of 0.25%), and Immigrants from Moldova (12.1%, a difference of 0.27%).
| Demographics | Rating | Rank | Female Poverty Among 25-34 Year Olds |
| Immigrants | Romania | 99.4 /100 | #58 | Exceptional 12.1% |
| Russians | 99.4 /100 | #59 | Exceptional 12.1% |
| Immigrants | Northern Europe | 99.4 /100 | #60 | Exceptional 12.1% |
| Immigrants | Czechoslovakia | 99.4 /100 | #61 | Exceptional 12.1% |
| Immigrants | Moldova | 99.3 /100 | #62 | Exceptional 12.1% |
| Soviet Union | 99.3 /100 | #63 | Exceptional 12.1% |
| Immigrants | Russia | 99.2 /100 | #64 | Exceptional 12.2% |
| Armenians | 99.2 /100 | #65 | Exceptional 12.2% |
| Immigrants | Europe | 99.2 /100 | #66 | Exceptional 12.2% |
| Laotians | 99.2 /100 | #67 | Exceptional 12.2% |
| Sri Lankans | 99.1 /100 | #68 | Exceptional 12.2% |
| Immigrants | Lebanon | 99.1 /100 | #69 | Exceptional 12.2% |
| Immigrants | Belgium | 99.1 /100 | #70 | Exceptional 12.2% |
| Immigrants | Scotland | 99.1 /100 | #71 | Exceptional 12.2% |
| Lithuanians | 99.1 /100 | #72 | Exceptional 12.2% |
Demographics Similar to Chippewa by Female Poverty Among 25-34 Year Olds
In terms of female poverty among 25-34 year olds, the demographic groups most similar to Chippewa are Choctaw (18.1%, a difference of 0.22%), Menominee (18.0%, a difference of 0.26%), Ute (17.9%, a difference of 0.81%), Central American Indian (18.2%, a difference of 1.1%), and Seminole (18.3%, a difference of 1.4%).
| Demographics | Rating | Rank | Female Poverty Among 25-34 Year Olds |
| Colville | 0.0 /100 | #313 | Tragic 17.5% |
| Immigrants | Dominican Republic | 0.0 /100 | #314 | Tragic 17.6% |
| Yakama | 0.0 /100 | #315 | Tragic 17.6% |
| Dominicans | 0.0 /100 | #316 | Tragic 17.6% |
| Arapaho | 0.0 /100 | #317 | Tragic 17.8% |
| Ute | 0.0 /100 | #318 | Tragic 17.9% |
| Menominee | 0.0 /100 | #319 | Tragic 18.0% |
| Chippewa | 0.0 /100 | #320 | Tragic 18.0% |
| Choctaw | 0.0 /100 | #321 | Tragic 18.1% |
| Central American Indians | 0.0 /100 | #322 | Tragic 18.2% |
| Seminole | 0.0 /100 | #323 | Tragic 18.3% |
| Dutch West Indians | 0.0 /100 | #324 | Tragic 18.4% |
| Inupiat | 0.0 /100 | #325 | Tragic 18.5% |
| Blacks/African Americans | 0.0 /100 | #326 | Tragic 18.9% |
| Cheyenne | 0.0 /100 | #327 | Tragic 19.1% |