Yuman vs Chippewa Female Poverty Among 25-34 Year Olds
COMPARE
Yuman
Chippewa
Female Poverty Among 25-34 Year Olds
Female Poverty Among 25-34 Year Olds Comparison
Yuman
Chippewa
22.9%
FEMALE POVERTY AMONG 25-34 YEAR OLDS
0.0/ 100
METRIC RATING
339th/ 347
METRIC RANK
18.0%
FEMALE POVERTY AMONG 25-34 YEAR OLDS
0.0/ 100
METRIC RATING
320th/ 347
METRIC RANK
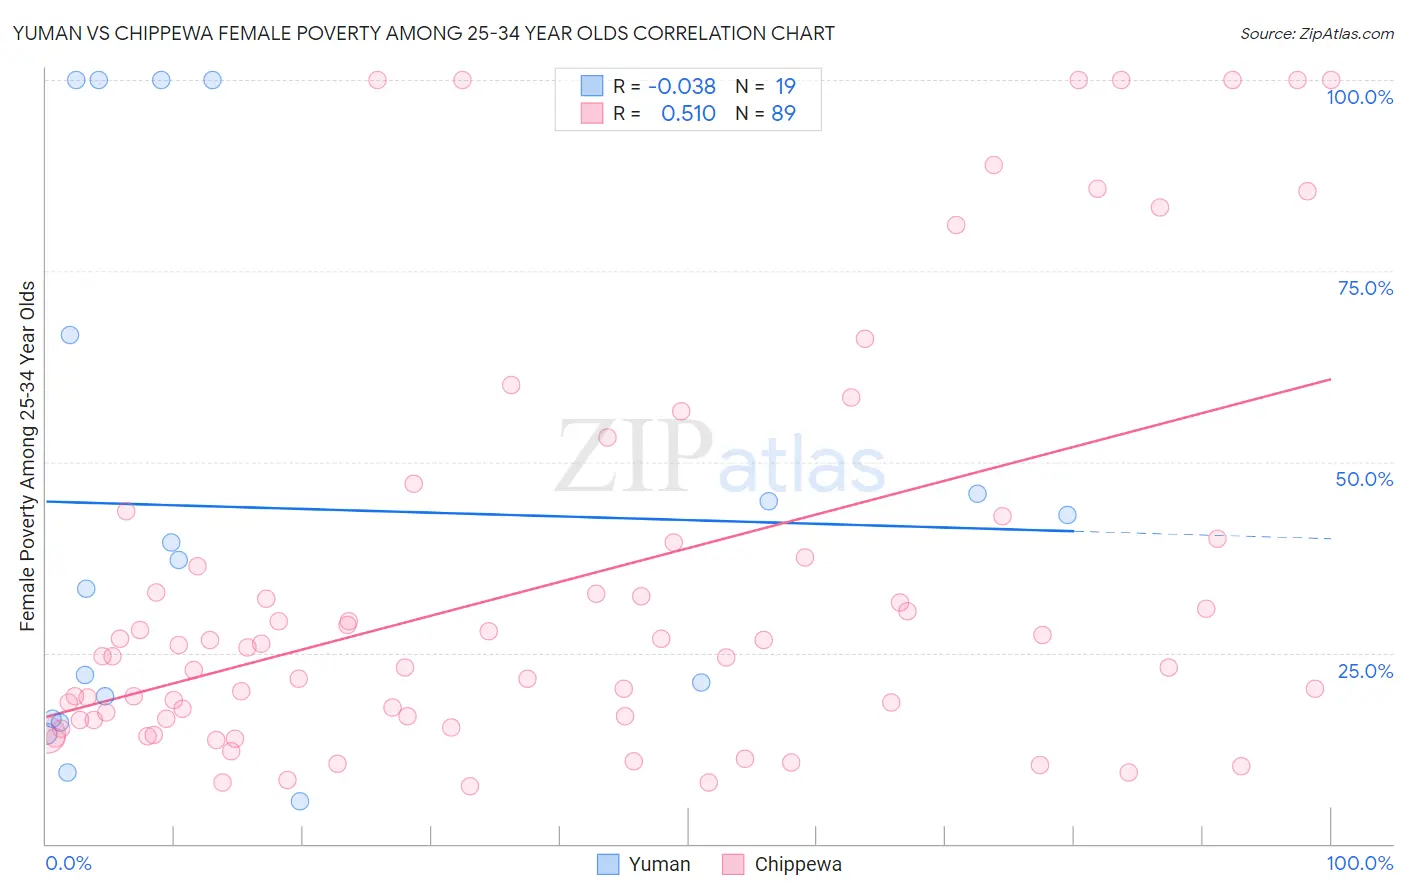
Yuman vs Chippewa Female Poverty Among 25-34 Year Olds Correlation Chart
The statistical analysis conducted on geographies consisting of 40,634,660 people shows no correlation between the proportion of Yuman and poverty level among females between the ages 25 and 34 in the United States with a correlation coefficient (R) of -0.038 and weighted average of 22.9%. Similarly, the statistical analysis conducted on geographies consisting of 213,001,722 people shows a substantial positive correlation between the proportion of Chippewa and poverty level among females between the ages 25 and 34 in the United States with a correlation coefficient (R) of 0.510 and weighted average of 18.0%, a difference of 27.2%.
Female Poverty Among 25-34 Year Olds Correlation Summary
| Measurement | Yuman | Chippewa |
| Minimum | 5.6% | 7.5% |
| Maximum | 100.0% | 100.0% |
| Range | 94.4% | 92.5% |
| Mean | 43.9% | 33.8% |
| Median | 37.2% | 24.5% |
| Interquartile 25% (IQ1) | 16.4% | 16.3% |
| Interquartile 75% (IQ3) | 66.7% | 38.5% |
| Interquartile Range (IQR) | 50.3% | 22.2% |
| Standard Deviation (Sample) | 33.3% | 26.8% |
| Standard Deviation (Population) | 32.4% | 26.6% |
Demographics Similar to Yuman and Chippewa by Female Poverty Among 25-34 Year Olds
In terms of female poverty among 25-34 year olds, the demographic groups most similar to Yuman are Houma (22.7%, a difference of 0.85%), Crow (22.7%, a difference of 1.0%), Pueblo (22.2%, a difference of 3.4%), Native/Alaskan (20.3%, a difference of 12.9%), and Apache (20.1%, a difference of 14.1%). Similarly, the demographic groups most similar to Chippewa are Choctaw (18.1%, a difference of 0.22%), Menominee (18.0%, a difference of 0.26%), Central American Indian (18.2%, a difference of 1.1%), Seminole (18.3%, a difference of 1.4%), and Dutch West Indian (18.4%, a difference of 2.4%).
| Demographics | Rating | Rank | Female Poverty Among 25-34 Year Olds |
| Menominee | 0.0 /100 | #319 | Tragic 18.0% |
| Chippewa | 0.0 /100 | #320 | Tragic 18.0% |
| Choctaw | 0.0 /100 | #321 | Tragic 18.1% |
| Central American Indians | 0.0 /100 | #322 | Tragic 18.2% |
| Seminole | 0.0 /100 | #323 | Tragic 18.3% |
| Dutch West Indians | 0.0 /100 | #324 | Tragic 18.4% |
| Inupiat | 0.0 /100 | #325 | Tragic 18.5% |
| Blacks/African Americans | 0.0 /100 | #326 | Tragic 18.9% |
| Cheyenne | 0.0 /100 | #327 | Tragic 19.1% |
| Alaskan Athabascans | 0.0 /100 | #328 | Tragic 19.1% |
| Creek | 0.0 /100 | #329 | Tragic 19.2% |
| Paiute | 0.0 /100 | #330 | Tragic 19.6% |
| Kiowa | 0.0 /100 | #331 | Tragic 19.7% |
| Immigrants | Yemen | 0.0 /100 | #332 | Tragic 19.8% |
| Cajuns | 0.0 /100 | #333 | Tragic 19.9% |
| Apache | 0.0 /100 | #334 | Tragic 20.1% |
| Natives/Alaskans | 0.0 /100 | #335 | Tragic 20.3% |
| Pueblo | 0.0 /100 | #336 | Tragic 22.2% |
| Crow | 0.0 /100 | #337 | Tragic 22.7% |
| Houma | 0.0 /100 | #338 | Tragic 22.7% |
| Yuman | 0.0 /100 | #339 | Tragic 22.9% |