Immigrants from Honduras vs American Female Poverty Among 25-34 Year Olds
COMPARE
Immigrants from Honduras
American
Female Poverty Among 25-34 Year Olds
Female Poverty Among 25-34 Year Olds Comparison
Immigrants from Honduras
Americans
17.3%
FEMALE POVERTY AMONG 25-34 YEAR OLDS
0.0/ 100
METRIC RATING
311th/ 347
METRIC RANK
16.4%
FEMALE POVERTY AMONG 25-34 YEAR OLDS
0.0/ 100
METRIC RATING
287th/ 347
METRIC RANK
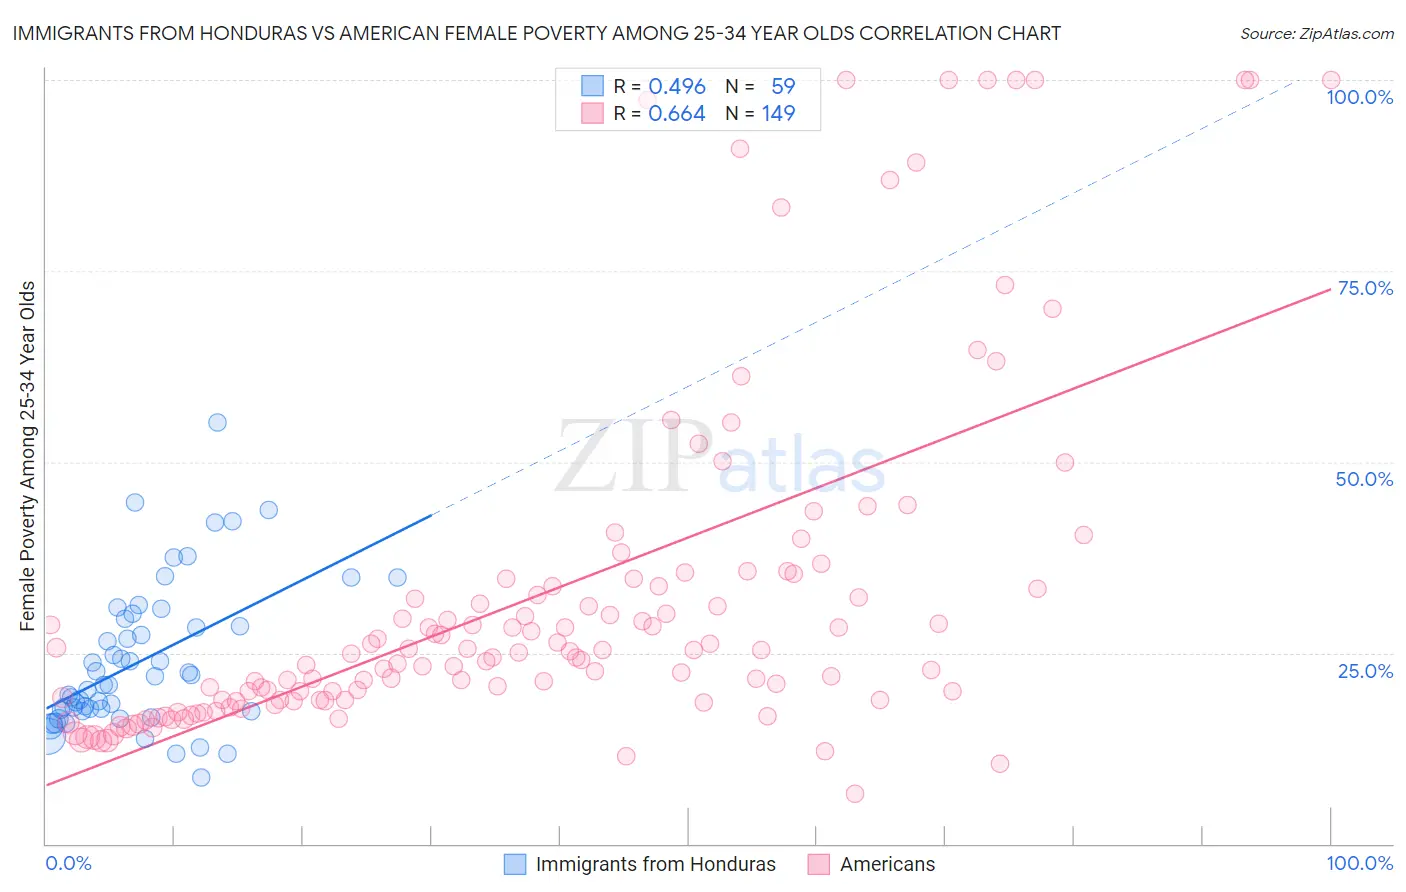
Immigrants from Honduras vs American Female Poverty Among 25-34 Year Olds Correlation Chart
The statistical analysis conducted on geographies consisting of 320,147,066 people shows a moderate positive correlation between the proportion of Immigrants from Honduras and poverty level among females between the ages 25 and 34 in the United States with a correlation coefficient (R) of 0.496 and weighted average of 17.3%. Similarly, the statistical analysis conducted on geographies consisting of 557,545,883 people shows a significant positive correlation between the proportion of Americans and poverty level among females between the ages 25 and 34 in the United States with a correlation coefficient (R) of 0.664 and weighted average of 16.4%, a difference of 5.6%.
Female Poverty Among 25-34 Year Olds Correlation Summary
| Measurement | Immigrants from Honduras | American |
| Minimum | 8.6% | 6.5% |
| Maximum | 55.1% | 100.0% |
| Range | 46.5% | 93.5% |
| Mean | 23.9% | 32.5% |
| Median | 20.8% | 25.0% |
| Interquartile 25% (IQ1) | 17.3% | 18.8% |
| Interquartile 75% (IQ3) | 29.5% | 34.2% |
| Interquartile Range (IQR) | 12.2% | 15.5% |
| Standard Deviation (Sample) | 9.6% | 22.9% |
| Standard Deviation (Population) | 9.5% | 22.8% |
Similar Demographics by Female Poverty Among 25-34 Year Olds
Demographics Similar to Immigrants from Honduras by Female Poverty Among 25-34 Year Olds
In terms of female poverty among 25-34 year olds, the demographic groups most similar to Immigrants from Honduras are Cherokee (17.2%, a difference of 0.48%), Ottawa (17.1%, a difference of 0.95%), Iroquois (17.5%, a difference of 1.1%), Colville (17.5%, a difference of 1.2%), and African (17.0%, a difference of 1.3%).
| Demographics | Rating | Rank | Female Poverty Among 25-34 Year Olds |
| Hondurans | 0.0 /100 | #304 | Tragic 16.9% |
| Immigrants | Cabo Verde | 0.0 /100 | #305 | Tragic 16.9% |
| Chickasaw | 0.0 /100 | #306 | Tragic 17.0% |
| Yaqui | 0.0 /100 | #307 | Tragic 17.0% |
| Africans | 0.0 /100 | #308 | Tragic 17.0% |
| Ottawa | 0.0 /100 | #309 | Tragic 17.1% |
| Cherokee | 0.0 /100 | #310 | Tragic 17.2% |
| Immigrants | Honduras | 0.0 /100 | #311 | Tragic 17.3% |
| Iroquois | 0.0 /100 | #312 | Tragic 17.5% |
| Colville | 0.0 /100 | #313 | Tragic 17.5% |
| Immigrants | Dominican Republic | 0.0 /100 | #314 | Tragic 17.6% |
| Yakama | 0.0 /100 | #315 | Tragic 17.6% |
| Dominicans | 0.0 /100 | #316 | Tragic 17.6% |
| Arapaho | 0.0 /100 | #317 | Tragic 17.8% |
| Ute | 0.0 /100 | #318 | Tragic 17.9% |
Demographics Similar to Americans by Female Poverty Among 25-34 Year Olds
In terms of female poverty among 25-34 year olds, the demographic groups most similar to Americans are Cape Verdean (16.3%, a difference of 0.050%), Guatemalan (16.4%, a difference of 0.19%), Immigrants from Bahamas (16.3%, a difference of 0.23%), Osage (16.4%, a difference of 0.25%), and Indonesian (16.4%, a difference of 0.40%).
| Demographics | Rating | Rank | Female Poverty Among 25-34 Year Olds |
| Bangladeshis | 0.0 /100 | #280 | Tragic 15.9% |
| Immigrants | Latin America | 0.0 /100 | #281 | Tragic 16.0% |
| Aleuts | 0.0 /100 | #282 | Tragic 16.1% |
| Bahamians | 0.0 /100 | #283 | Tragic 16.1% |
| Shoshone | 0.0 /100 | #284 | Tragic 16.2% |
| Immigrants | Bahamas | 0.0 /100 | #285 | Tragic 16.3% |
| Cape Verdeans | 0.0 /100 | #286 | Tragic 16.3% |
| Americans | 0.0 /100 | #287 | Tragic 16.4% |
| Guatemalans | 0.0 /100 | #288 | Tragic 16.4% |
| Osage | 0.0 /100 | #289 | Tragic 16.4% |
| Indonesians | 0.0 /100 | #290 | Tragic 16.4% |
| Comanche | 0.0 /100 | #291 | Tragic 16.5% |
| Immigrants | Dominica | 0.0 /100 | #292 | Tragic 16.5% |
| Potawatomi | 0.0 /100 | #293 | Tragic 16.5% |
| Immigrants | Central America | 0.0 /100 | #294 | Tragic 16.6% |