Immigrants from Eritrea vs Shoshone Median Family Income
COMPARE
Immigrants from Eritrea
Shoshone
Median Family Income
Median Family Income Comparison
Immigrants from Eritrea
Shoshone
$102,823
MEDIAN FAMILY INCOME
51.9/ 100
METRIC RATING
172nd/ 347
METRIC RANK
$87,872
MEDIAN FAMILY INCOME
0.1/ 100
METRIC RATING
290th/ 347
METRIC RANK
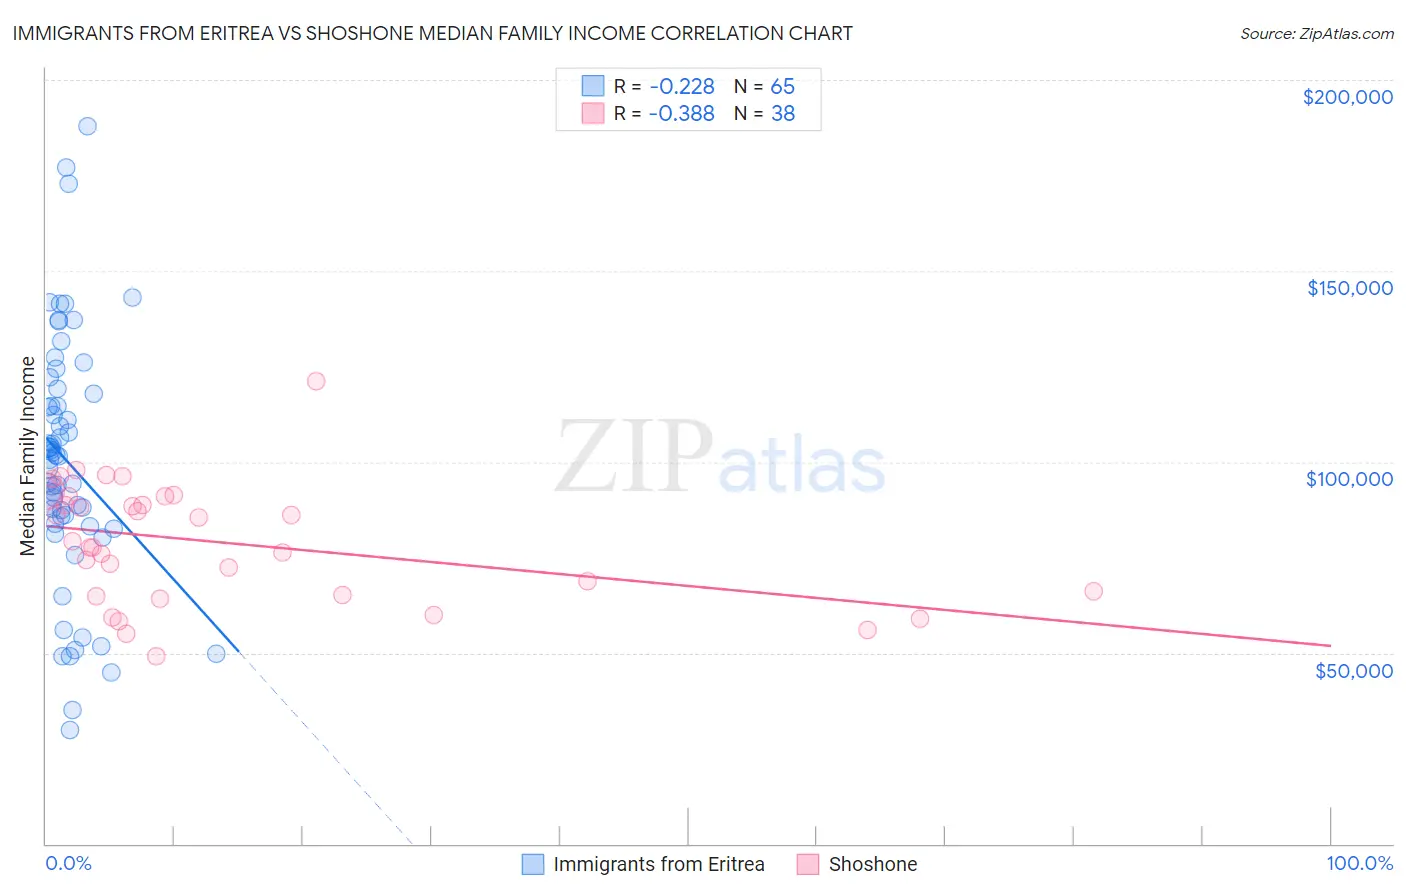
Immigrants from Eritrea vs Shoshone Median Family Income Correlation Chart
The statistical analysis conducted on geographies consisting of 104,842,839 people shows a weak negative correlation between the proportion of Immigrants from Eritrea and median family income in the United States with a correlation coefficient (R) of -0.228 and weighted average of $102,823. Similarly, the statistical analysis conducted on geographies consisting of 66,610,248 people shows a mild negative correlation between the proportion of Shoshone and median family income in the United States with a correlation coefficient (R) of -0.388 and weighted average of $87,872, a difference of 17.0%.
Median Family Income Correlation Summary
| Measurement | Immigrants from Eritrea | Shoshone |
| Minimum | $29,777 | $49,050 |
| Maximum | $188,047 | $121,000 |
| Range | $158,270 | $71,950 |
| Mean | $99,919 | $78,936 |
| Median | $101,536 | $78,378 |
| Interquartile 25% (IQ1) | $83,487 | $65,000 |
| Interquartile 75% (IQ3) | $118,485 | $90,917 |
| Interquartile Range (IQR) | $34,998 | $25,917 |
| Standard Deviation (Sample) | $32,848 | $15,660 |
| Standard Deviation (Population) | $32,595 | $15,453 |
Similar Demographics by Median Family Income
Demographics Similar to Immigrants from Eritrea by Median Family Income
In terms of median family income, the demographic groups most similar to Immigrants from Eritrea are Belgian ($102,788, a difference of 0.030%), Finnish ($102,676, a difference of 0.14%), Alsatian ($103,010, a difference of 0.18%), Immigrants from Uzbekistan ($103,197, a difference of 0.36%), and Immigrants from Eastern Africa ($102,451, a difference of 0.36%).
| Demographics | Rating | Rank | Median Family Income |
| Slovaks | 63.1 /100 | #165 | Good $103,729 |
| English | 62.6 /100 | #166 | Good $103,684 |
| South American Indians | 61.9 /100 | #167 | Good $103,624 |
| Immigrants | Peru | 60.8 /100 | #168 | Good $103,534 |
| Czechoslovakians | 57.6 /100 | #169 | Average $103,273 |
| Immigrants | Uzbekistan | 56.6 /100 | #170 | Average $103,197 |
| Alsatians | 54.3 /100 | #171 | Average $103,010 |
| Immigrants | Eritrea | 51.9 /100 | #172 | Average $102,823 |
| Belgians | 51.4 /100 | #173 | Average $102,788 |
| Finns | 50.0 /100 | #174 | Average $102,676 |
| Immigrants | Eastern Africa | 47.1 /100 | #175 | Average $102,451 |
| French | 46.1 /100 | #176 | Average $102,368 |
| Germans | 44.6 /100 | #177 | Average $102,254 |
| Welsh | 43.3 /100 | #178 | Average $102,151 |
| South Americans | 39.7 /100 | #179 | Fair $101,856 |
Demographics Similar to Shoshone by Median Family Income
In terms of median family income, the demographic groups most similar to Shoshone are Immigrants from Cabo Verde ($87,830, a difference of 0.050%), African ($87,820, a difference of 0.060%), Central American Indian ($88,034, a difference of 0.19%), Ute ($87,596, a difference of 0.32%), and Cherokee ($88,209, a difference of 0.38%).
| Demographics | Rating | Rank | Median Family Income |
| Bangladeshis | 0.1 /100 | #283 | Tragic $88,358 |
| Indonesians | 0.1 /100 | #284 | Tragic $88,301 |
| Guatemalans | 0.1 /100 | #285 | Tragic $88,295 |
| Immigrants | Nicaragua | 0.1 /100 | #286 | Tragic $88,267 |
| Potawatomi | 0.1 /100 | #287 | Tragic $88,265 |
| Cherokee | 0.1 /100 | #288 | Tragic $88,209 |
| Central American Indians | 0.1 /100 | #289 | Tragic $88,034 |
| Shoshone | 0.1 /100 | #290 | Tragic $87,872 |
| Immigrants | Cabo Verde | 0.1 /100 | #291 | Tragic $87,830 |
| Africans | 0.1 /100 | #292 | Tragic $87,820 |
| Ute | 0.0 /100 | #293 | Tragic $87,596 |
| Fijians | 0.0 /100 | #294 | Tragic $87,387 |
| Yaqui | 0.0 /100 | #295 | Tragic $87,289 |
| Immigrants | Guatemala | 0.0 /100 | #296 | Tragic $87,191 |
| Cajuns | 0.0 /100 | #297 | Tragic $87,157 |