Immigrants from England vs Immigrants from Saudi Arabia Married-Couple Family Poverty
COMPARE
Immigrants from England
Immigrants from Saudi Arabia
Married-Couple Family Poverty
Married-Couple Family Poverty Comparison
Immigrants from England
Immigrants from Saudi Arabia
4.5%
MARRIED-COUPLE FAMILY POVERTY
99.3/ 100
METRIC RATING
72nd/ 347
METRIC RANK
5.1%
MARRIED-COUPLE FAMILY POVERTY
70.3/ 100
METRIC RATING
159th/ 347
METRIC RANK
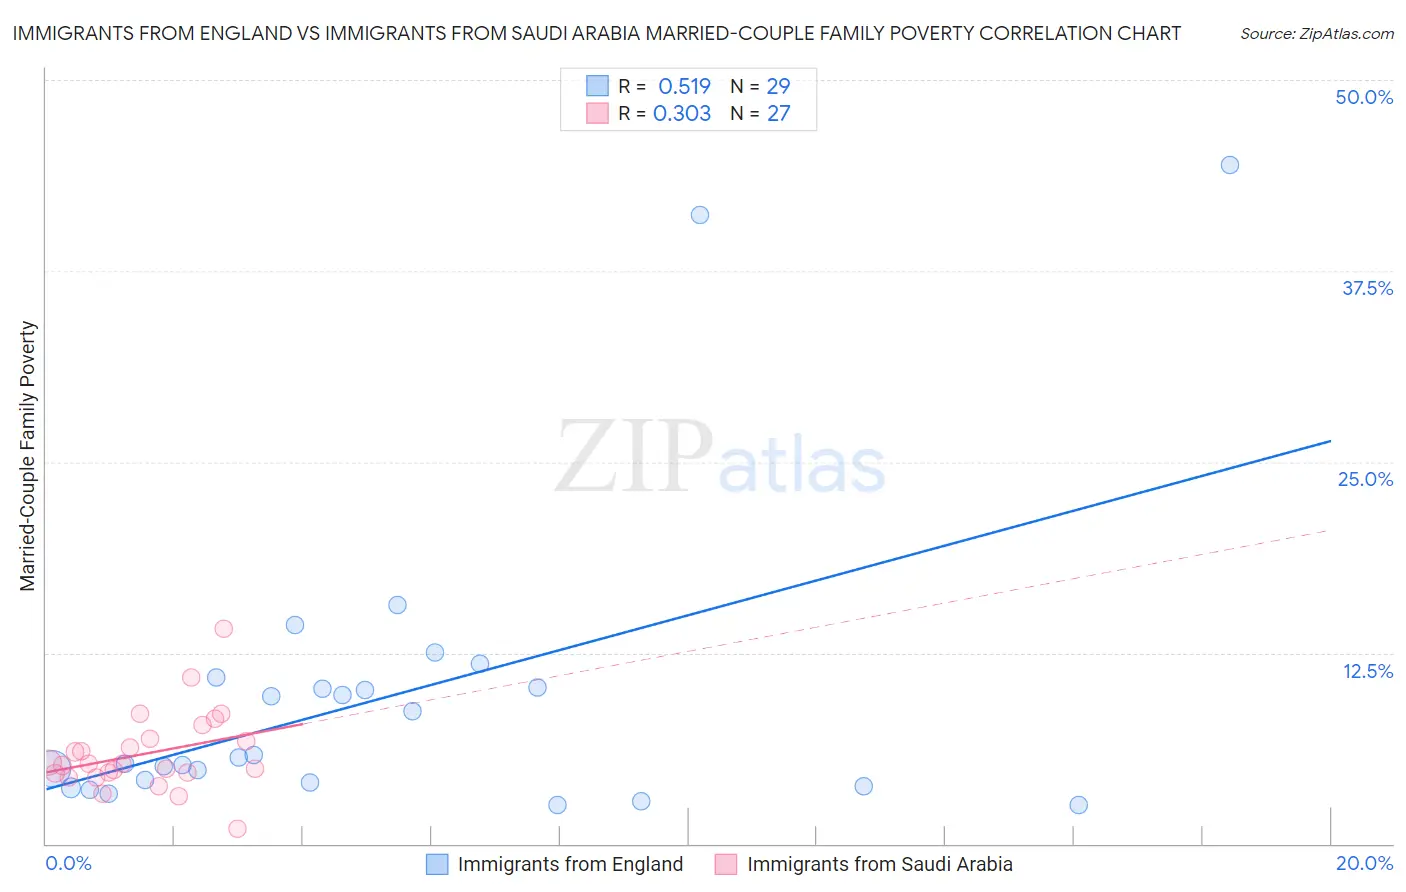
Immigrants from England vs Immigrants from Saudi Arabia Married-Couple Family Poverty Correlation Chart
The statistical analysis conducted on geographies consisting of 387,900,706 people shows a substantial positive correlation between the proportion of Immigrants from England and poverty level among married-couple families in the United States with a correlation coefficient (R) of 0.519 and weighted average of 4.5%. Similarly, the statistical analysis conducted on geographies consisting of 163,790,795 people shows a mild positive correlation between the proportion of Immigrants from Saudi Arabia and poverty level among married-couple families in the United States with a correlation coefficient (R) of 0.303 and weighted average of 5.1%, a difference of 13.7%.
Married-Couple Family Poverty Correlation Summary
| Measurement | Immigrants from England | Immigrants from Saudi Arabia |
| Minimum | 2.5% | 0.95% |
| Maximum | 44.4% | 14.1% |
| Range | 41.9% | 13.2% |
| Mean | 9.5% | 5.9% |
| Median | 5.6% | 5.2% |
| Interquartile 25% (IQ1) | 3.9% | 4.6% |
| Interquartile 75% (IQ3) | 10.5% | 6.8% |
| Interquartile Range (IQR) | 6.6% | 2.2% |
| Standard Deviation (Sample) | 10.0% | 2.6% |
| Standard Deviation (Population) | 9.8% | 2.6% |
Similar Demographics by Married-Couple Family Poverty
Demographics Similar to Immigrants from England by Married-Couple Family Poverty
In terms of married-couple family poverty, the demographic groups most similar to Immigrants from England are Immigrants from North America (4.5%, a difference of 0.090%), Ukrainian (4.5%, a difference of 0.12%), Immigrants from Austria (4.5%, a difference of 0.22%), Cambodian (4.5%, a difference of 0.49%), and Immigrants from Korea (4.5%, a difference of 0.51%).
| Demographics | Rating | Rank | Married-Couple Family Poverty |
| Macedonians | 99.4 /100 | #65 | Exceptional 4.4% |
| Immigrants | Serbia | 99.4 /100 | #66 | Exceptional 4.4% |
| Immigrants | Canada | 99.4 /100 | #67 | Exceptional 4.4% |
| Slavs | 99.4 /100 | #68 | Exceptional 4.4% |
| New Zealanders | 99.4 /100 | #69 | Exceptional 4.4% |
| Immigrants | Korea | 99.4 /100 | #70 | Exceptional 4.5% |
| Immigrants | North America | 99.3 /100 | #71 | Exceptional 4.5% |
| Immigrants | England | 99.3 /100 | #72 | Exceptional 4.5% |
| Ukrainians | 99.2 /100 | #73 | Exceptional 4.5% |
| Immigrants | Austria | 99.2 /100 | #74 | Exceptional 4.5% |
| Cambodians | 99.2 /100 | #75 | Exceptional 4.5% |
| Immigrants | South Africa | 99.1 /100 | #76 | Exceptional 4.5% |
| Immigrants | Latvia | 99.1 /100 | #77 | Exceptional 4.5% |
| Scotch-Irish | 99.1 /100 | #78 | Exceptional 4.5% |
| Immigrants | Iran | 99.0 /100 | #79 | Exceptional 4.5% |
Demographics Similar to Immigrants from Saudi Arabia by Married-Couple Family Poverty
In terms of married-couple family poverty, the demographic groups most similar to Immigrants from Saudi Arabia are Immigrants from South Eastern Asia (5.1%, a difference of 0.0%), Argentinean (5.1%, a difference of 0.050%), Pennsylvania German (5.1%, a difference of 0.26%), Sri Lankan (5.1%, a difference of 0.27%), and Immigrants from Ethiopia (5.1%, a difference of 0.31%).
| Demographics | Rating | Rank | Married-Couple Family Poverty |
| Albanians | 77.2 /100 | #152 | Good 5.0% |
| Immigrants | Kuwait | 76.3 /100 | #153 | Good 5.0% |
| Delaware | 73.7 /100 | #154 | Good 5.1% |
| Immigrants | Ethiopia | 72.4 /100 | #155 | Good 5.1% |
| Sri Lankans | 72.2 /100 | #156 | Good 5.1% |
| Argentineans | 70.7 /100 | #157 | Good 5.1% |
| Immigrants | South Eastern Asia | 70.4 /100 | #158 | Good 5.1% |
| Immigrants | Saudi Arabia | 70.3 /100 | #159 | Good 5.1% |
| Pennsylvania Germans | 68.5 /100 | #160 | Good 5.1% |
| Ethiopians | 68.1 /100 | #161 | Good 5.1% |
| Immigrants | Jordan | 66.5 /100 | #162 | Good 5.1% |
| Sierra Leoneans | 64.1 /100 | #163 | Good 5.1% |
| Hawaiians | 62.3 /100 | #164 | Good 5.1% |
| Immigrants | Malaysia | 62.2 /100 | #165 | Good 5.1% |
| Paraguayans | 61.5 /100 | #166 | Good 5.1% |