Immigrants from England vs Immigrants from Saudi Arabia Unemployment Among Ages 65 to 74 years
COMPARE
Immigrants from England
Immigrants from Saudi Arabia
Unemployment Among Ages 65 to 74 years
Unemployment Among Ages 65 to 74 years Comparison
Immigrants from England
Immigrants from Saudi Arabia
5.3%
UNEMPLOYMENT AMONG AGES 65 TO 74 YEARS
86.2/ 100
METRIC RATING
129th/ 347
METRIC RANK
5.2%
UNEMPLOYMENT AMONG AGES 65 TO 74 YEARS
97.9/ 100
METRIC RATING
88th/ 347
METRIC RANK
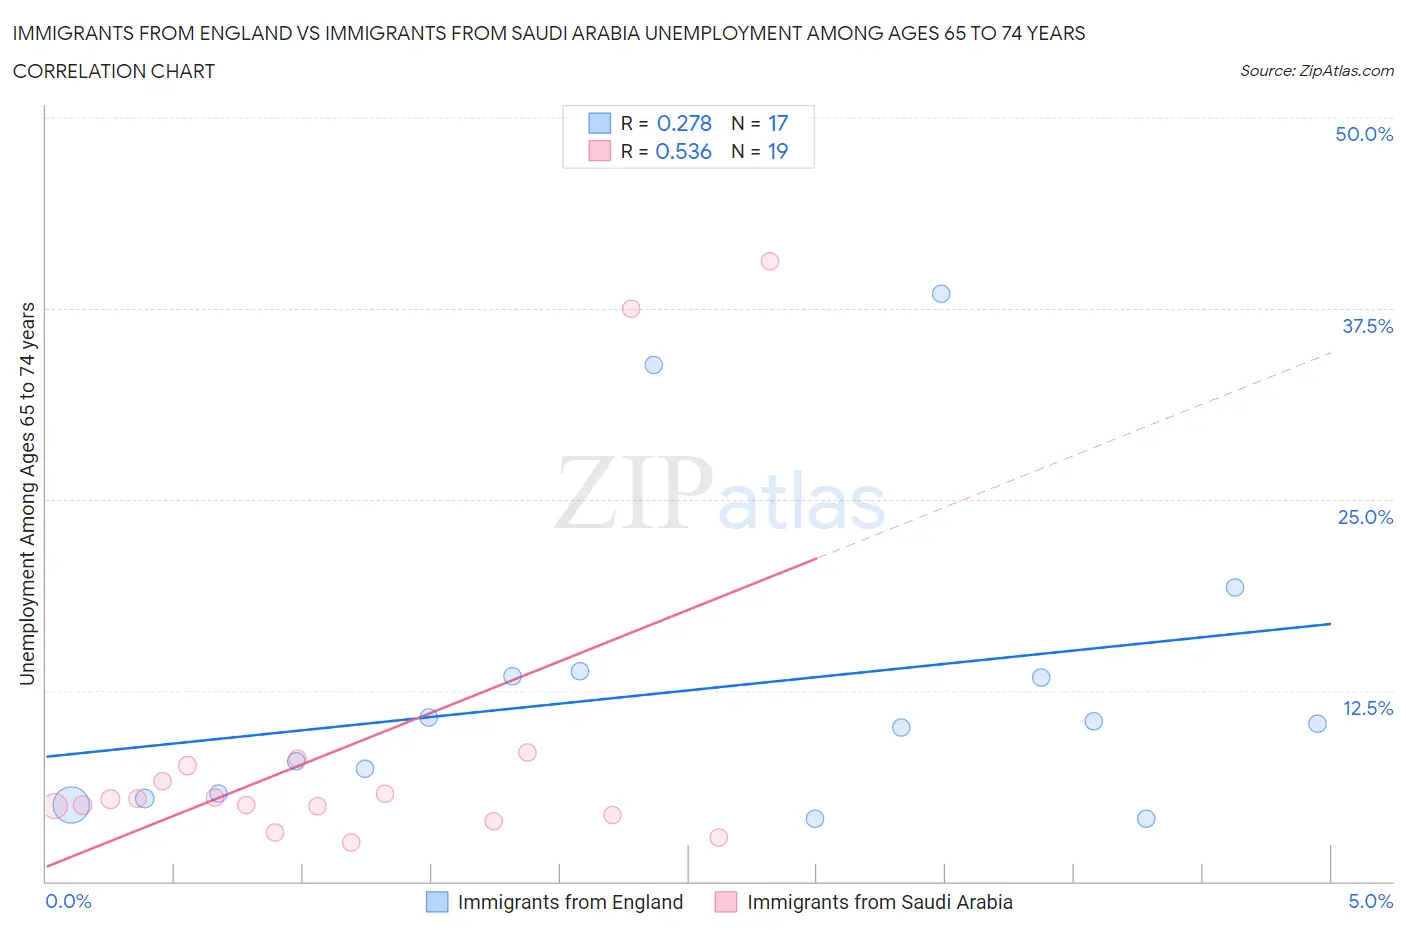
Immigrants from England vs Immigrants from Saudi Arabia Unemployment Among Ages 65 to 74 years Correlation Chart
The statistical analysis conducted on geographies consisting of 344,296,821 people shows a weak positive correlation between the proportion of Immigrants from England and unemployment rate among population between the ages 65 and 74 in the United States with a correlation coefficient (R) of 0.278 and weighted average of 5.3%. Similarly, the statistical analysis conducted on geographies consisting of 155,372,091 people shows a substantial positive correlation between the proportion of Immigrants from Saudi Arabia and unemployment rate among population between the ages 65 and 74 in the United States with a correlation coefficient (R) of 0.536 and weighted average of 5.2%, a difference of 1.7%.
Unemployment Among Ages 65 to 74 years Correlation Summary
| Measurement | Immigrants from England | Immigrants from Saudi Arabia |
| Minimum | 4.1% | 2.6% |
| Maximum | 38.5% | 40.6% |
| Range | 34.4% | 38.0% |
| Mean | 12.5% | 8.8% |
| Median | 10.3% | 5.4% |
| Interquartile 25% (IQ1) | 5.6% | 4.3% |
| Interquartile 75% (IQ3) | 13.6% | 7.6% |
| Interquartile Range (IQR) | 8.0% | 3.3% |
| Standard Deviation (Sample) | 9.8% | 10.8% |
| Standard Deviation (Population) | 9.5% | 10.5% |
Similar Demographics by Unemployment Among Ages 65 to 74 years
Demographics Similar to Immigrants from England by Unemployment Among Ages 65 to 74 years
In terms of unemployment among ages 65 to 74 years, the demographic groups most similar to Immigrants from England are Immigrants from Hong Kong (5.3%, a difference of 0.030%), Immigrants from North America (5.3%, a difference of 0.040%), Eastern European (5.3%, a difference of 0.040%), Immigrants from South Eastern Asia (5.3%, a difference of 0.070%), and Pakistani (5.3%, a difference of 0.090%).
| Demographics | Rating | Rank | Unemployment Among Ages 65 to 74 years |
| Immigrants | Canada | 89.0 /100 | #122 | Excellent 5.3% |
| Czechoslovakians | 88.6 /100 | #123 | Excellent 5.3% |
| Immigrants | Ukraine | 87.5 /100 | #124 | Excellent 5.3% |
| Pakistanis | 87.5 /100 | #125 | Excellent 5.3% |
| Immigrants | South Eastern Asia | 87.2 /100 | #126 | Excellent 5.3% |
| Immigrants | North America | 86.7 /100 | #127 | Excellent 5.3% |
| Immigrants | Hong Kong | 86.5 /100 | #128 | Excellent 5.3% |
| Immigrants | England | 86.2 /100 | #129 | Excellent 5.3% |
| Eastern Europeans | 85.6 /100 | #130 | Excellent 5.3% |
| Immigrants | Russia | 83.0 /100 | #131 | Excellent 5.3% |
| Koreans | 82.6 /100 | #132 | Excellent 5.3% |
| Ukrainians | 82.0 /100 | #133 | Excellent 5.3% |
| Immigrants | Panama | 81.8 /100 | #134 | Excellent 5.3% |
| Immigrants | Serbia | 81.8 /100 | #135 | Excellent 5.3% |
| Celtics | 80.8 /100 | #136 | Excellent 5.3% |
Demographics Similar to Immigrants from Saudi Arabia by Unemployment Among Ages 65 to 74 years
In terms of unemployment among ages 65 to 74 years, the demographic groups most similar to Immigrants from Saudi Arabia are English (5.2%, a difference of 0.010%), Danish (5.2%, a difference of 0.020%), Scottish (5.2%, a difference of 0.020%), British (5.2%, a difference of 0.030%), and Immigrants from Hungary (5.2%, a difference of 0.060%).
| Demographics | Rating | Rank | Unemployment Among Ages 65 to 74 years |
| Immigrants | Scotland | 98.6 /100 | #81 | Exceptional 5.2% |
| Thais | 98.6 /100 | #82 | Exceptional 5.2% |
| Immigrants | Middle Africa | 98.4 /100 | #83 | Exceptional 5.2% |
| Immigrants | Hungary | 98.0 /100 | #84 | Exceptional 5.2% |
| British | 97.9 /100 | #85 | Exceptional 5.2% |
| Danes | 97.9 /100 | #86 | Exceptional 5.2% |
| Scottish | 97.9 /100 | #87 | Exceptional 5.2% |
| Immigrants | Saudi Arabia | 97.9 /100 | #88 | Exceptional 5.2% |
| English | 97.8 /100 | #89 | Exceptional 5.2% |
| Luxembourgers | 97.6 /100 | #90 | Exceptional 5.2% |
| Romanians | 97.4 /100 | #91 | Exceptional 5.2% |
| Puget Sound Salish | 97.3 /100 | #92 | Exceptional 5.2% |
| Immigrants | Netherlands | 97.1 /100 | #93 | Exceptional 5.2% |
| South Africans | 97.1 /100 | #94 | Exceptional 5.2% |
| Serbians | 97.0 /100 | #95 | Exceptional 5.2% |