Immigrants from El Salvador vs Argentinean Poverty
COMPARE
Immigrants from El Salvador
Argentinean
Poverty
Poverty Comparison
Immigrants from El Salvador
Argentineans
14.3%
POVERTY
0.1/ 100
METRIC RATING
254th/ 347
METRIC RANK
11.7%
POVERTY
89.1/ 100
METRIC RATING
118th/ 347
METRIC RANK
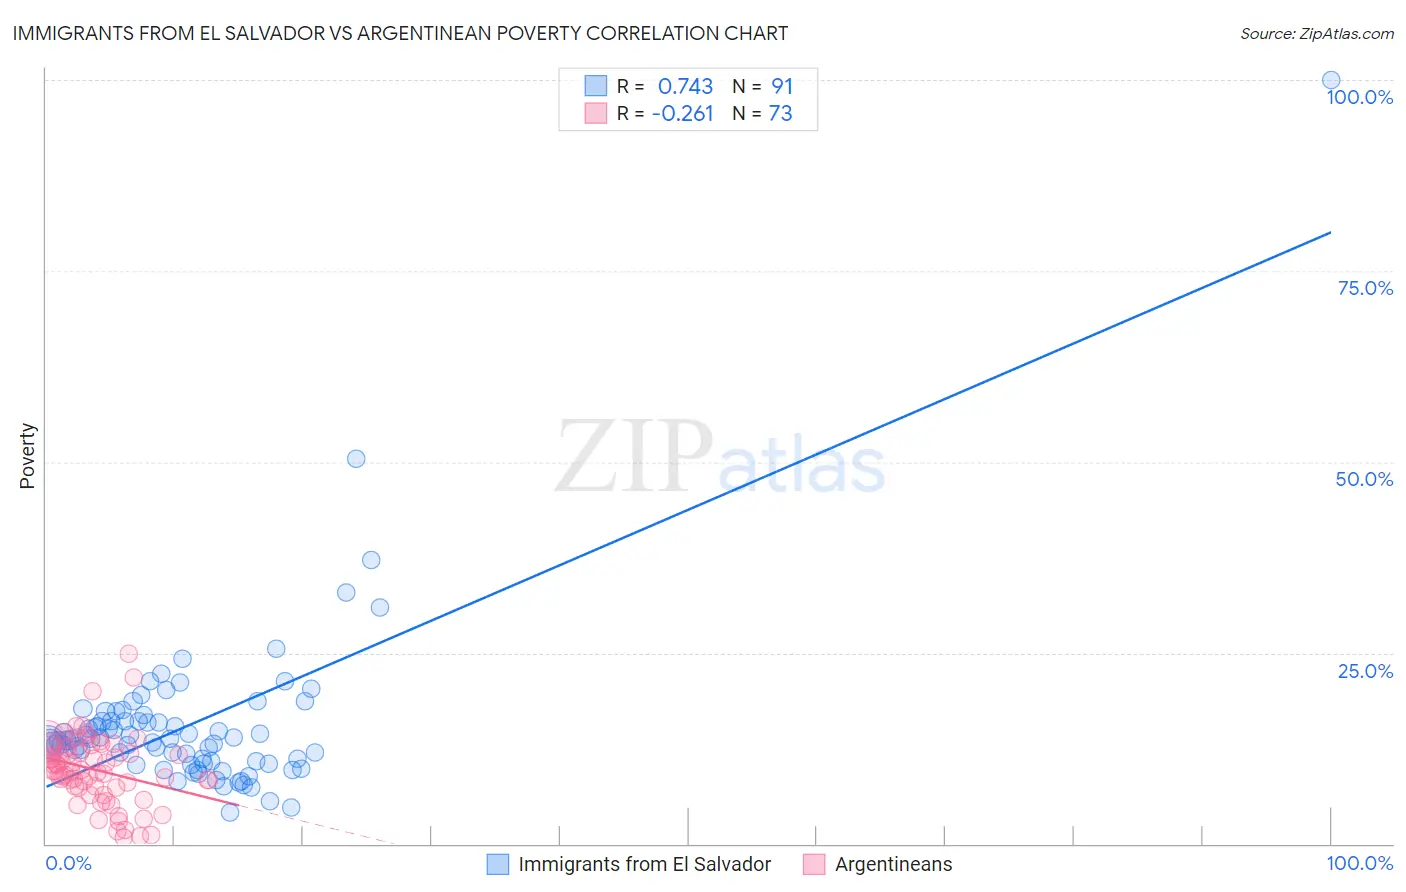
Immigrants from El Salvador vs Argentinean Poverty Correlation Chart
The statistical analysis conducted on geographies consisting of 357,703,291 people shows a strong positive correlation between the proportion of Immigrants from El Salvador and poverty level in the United States with a correlation coefficient (R) of 0.743 and weighted average of 14.3%. Similarly, the statistical analysis conducted on geographies consisting of 296,986,445 people shows a weak negative correlation between the proportion of Argentineans and poverty level in the United States with a correlation coefficient (R) of -0.261 and weighted average of 11.7%, a difference of 22.1%.
Poverty Correlation Summary
| Measurement | Immigrants from El Salvador | Argentinean |
| Minimum | 4.1% | 0.81% |
| Maximum | 100.0% | 24.8% |
| Range | 95.9% | 24.0% |
| Mean | 15.6% | 9.7% |
| Median | 13.5% | 9.6% |
| Interquartile 25% (IQ1) | 10.8% | 7.4% |
| Interquartile 75% (IQ3) | 16.1% | 12.5% |
| Interquartile Range (IQR) | 5.3% | 5.1% |
| Standard Deviation (Sample) | 11.2% | 4.6% |
| Standard Deviation (Population) | 11.1% | 4.5% |
Similar Demographics by Poverty
Demographics Similar to Immigrants from El Salvador by Poverty
In terms of poverty, the demographic groups most similar to Immigrants from El Salvador are Immigrants from Ecuador (14.3%, a difference of 0.10%), Mexican American Indian (14.3%, a difference of 0.11%), Trinidadian and Tobagonian (14.3%, a difference of 0.16%), Ottawa (14.3%, a difference of 0.17%), and Immigrants from Trinidad and Tobago (14.2%, a difference of 0.25%).
| Demographics | Rating | Rank | Poverty |
| Liberians | 0.2 /100 | #247 | Tragic 14.1% |
| Immigrants | Western Africa | 0.2 /100 | #248 | Tragic 14.1% |
| Immigrants | Ghana | 0.2 /100 | #249 | Tragic 14.2% |
| Cree | 0.2 /100 | #250 | Tragic 14.2% |
| Immigrants | Burma/Myanmar | 0.2 /100 | #251 | Tragic 14.2% |
| Spanish American Indians | 0.2 /100 | #252 | Tragic 14.2% |
| Immigrants | Trinidad and Tobago | 0.2 /100 | #253 | Tragic 14.2% |
| Immigrants | El Salvador | 0.1 /100 | #254 | Tragic 14.3% |
| Immigrants | Ecuador | 0.1 /100 | #255 | Tragic 14.3% |
| Mexican American Indians | 0.1 /100 | #256 | Tragic 14.3% |
| Trinidadians and Tobagonians | 0.1 /100 | #257 | Tragic 14.3% |
| Ottawa | 0.1 /100 | #258 | Tragic 14.3% |
| Immigrants | Nicaragua | 0.1 /100 | #259 | Tragic 14.3% |
| Cape Verdeans | 0.1 /100 | #260 | Tragic 14.4% |
| Cherokee | 0.1 /100 | #261 | Tragic 14.4% |
Demographics Similar to Argentineans by Poverty
In terms of poverty, the demographic groups most similar to Argentineans are Tlingit-Haida (11.7%, a difference of 0.040%), Immigrants from South Eastern Asia (11.7%, a difference of 0.050%), Sri Lankan (11.7%, a difference of 0.080%), New Zealander (11.7%, a difference of 0.11%), and Puget Sound Salish (11.7%, a difference of 0.11%).
| Demographics | Rating | Rank | Poverty |
| French Canadians | 91.0 /100 | #111 | Exceptional 11.6% |
| Immigrants | Southern Europe | 90.8 /100 | #112 | Exceptional 11.6% |
| Immigrants | Belarus | 90.8 /100 | #113 | Exceptional 11.6% |
| Immigrants | China | 90.7 /100 | #114 | Exceptional 11.6% |
| Albanians | 90.3 /100 | #115 | Exceptional 11.7% |
| Immigrants | Russia | 89.7 /100 | #116 | Excellent 11.7% |
| Sri Lankans | 89.4 /100 | #117 | Excellent 11.7% |
| Argentineans | 89.1 /100 | #118 | Excellent 11.7% |
| Tlingit-Haida | 89.0 /100 | #119 | Excellent 11.7% |
| Immigrants | South Eastern Asia | 88.9 /100 | #120 | Excellent 11.7% |
| New Zealanders | 88.7 /100 | #121 | Excellent 11.7% |
| Puget Sound Salish | 88.7 /100 | #122 | Excellent 11.7% |
| Immigrants | Hungary | 88.6 /100 | #123 | Excellent 11.7% |
| Soviet Union | 88.4 /100 | #124 | Excellent 11.7% |
| Immigrants | Brazil | 88.2 /100 | #125 | Excellent 11.7% |