Immigrants from El Salvador vs American Poverty
COMPARE
Immigrants from El Salvador
American
Poverty
Poverty Comparison
Immigrants from El Salvador
Americans
14.3%
POVERTY
0.1/ 100
METRIC RATING
254th/ 347
METRIC RANK
13.4%
POVERTY
2.9/ 100
METRIC RATING
220th/ 347
METRIC RANK
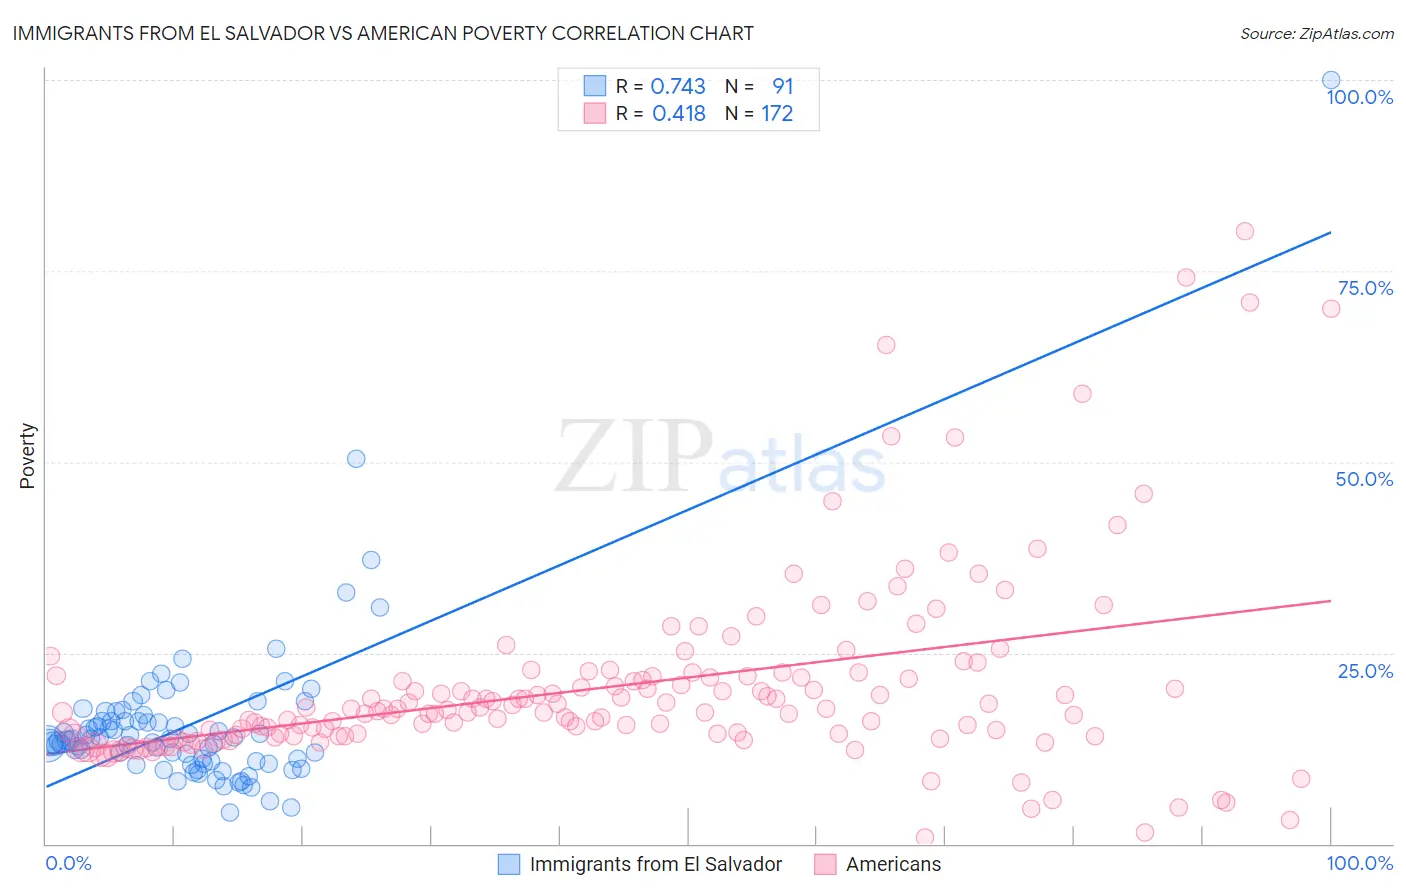
Immigrants from El Salvador vs American Poverty Correlation Chart
The statistical analysis conducted on geographies consisting of 357,703,291 people shows a strong positive correlation between the proportion of Immigrants from El Salvador and poverty level in the United States with a correlation coefficient (R) of 0.743 and weighted average of 14.3%. Similarly, the statistical analysis conducted on geographies consisting of 580,977,330 people shows a moderate positive correlation between the proportion of Americans and poverty level in the United States with a correlation coefficient (R) of 0.418 and weighted average of 13.4%, a difference of 6.8%.
Poverty Correlation Summary
| Measurement | Immigrants from El Salvador | American |
| Minimum | 4.1% | 0.85% |
| Maximum | 100.0% | 80.3% |
| Range | 95.9% | 79.4% |
| Mean | 15.6% | 20.5% |
| Median | 13.5% | 17.2% |
| Interquartile 25% (IQ1) | 10.8% | 14.1% |
| Interquartile 75% (IQ3) | 16.1% | 21.9% |
| Interquartile Range (IQR) | 5.3% | 7.8% |
| Standard Deviation (Sample) | 11.2% | 12.6% |
| Standard Deviation (Population) | 11.1% | 12.5% |
Similar Demographics by Poverty
Demographics Similar to Immigrants from El Salvador by Poverty
In terms of poverty, the demographic groups most similar to Immigrants from El Salvador are Immigrants from Ecuador (14.3%, a difference of 0.10%), Mexican American Indian (14.3%, a difference of 0.11%), Trinidadian and Tobagonian (14.3%, a difference of 0.16%), Ottawa (14.3%, a difference of 0.17%), and Immigrants from Trinidad and Tobago (14.2%, a difference of 0.25%).
| Demographics | Rating | Rank | Poverty |
| Liberians | 0.2 /100 | #247 | Tragic 14.1% |
| Immigrants | Western Africa | 0.2 /100 | #248 | Tragic 14.1% |
| Immigrants | Ghana | 0.2 /100 | #249 | Tragic 14.2% |
| Cree | 0.2 /100 | #250 | Tragic 14.2% |
| Immigrants | Burma/Myanmar | 0.2 /100 | #251 | Tragic 14.2% |
| Spanish American Indians | 0.2 /100 | #252 | Tragic 14.2% |
| Immigrants | Trinidad and Tobago | 0.2 /100 | #253 | Tragic 14.2% |
| Immigrants | El Salvador | 0.1 /100 | #254 | Tragic 14.3% |
| Immigrants | Ecuador | 0.1 /100 | #255 | Tragic 14.3% |
| Mexican American Indians | 0.1 /100 | #256 | Tragic 14.3% |
| Trinidadians and Tobagonians | 0.1 /100 | #257 | Tragic 14.3% |
| Ottawa | 0.1 /100 | #258 | Tragic 14.3% |
| Immigrants | Nicaragua | 0.1 /100 | #259 | Tragic 14.3% |
| Cape Verdeans | 0.1 /100 | #260 | Tragic 14.4% |
| Cherokee | 0.1 /100 | #261 | Tragic 14.4% |
Demographics Similar to Americans by Poverty
In terms of poverty, the demographic groups most similar to Americans are Immigrants from Cambodia (13.4%, a difference of 0.090%), Alsatian (13.4%, a difference of 0.20%), Immigrants from Thailand (13.3%, a difference of 0.21%), Immigrants from Micronesia (13.4%, a difference of 0.24%), and Immigrants from Uzbekistan (13.3%, a difference of 0.28%).
| Demographics | Rating | Rank | Poverty |
| Immigrants | Panama | 4.1 /100 | #213 | Tragic 13.3% |
| Bermudans | 3.7 /100 | #214 | Tragic 13.3% |
| Japanese | 3.3 /100 | #215 | Tragic 13.3% |
| Immigrants | Nonimmigrants | 3.3 /100 | #216 | Tragic 13.3% |
| Immigrants | Uzbekistan | 3.2 /100 | #217 | Tragic 13.3% |
| Immigrants | Thailand | 3.1 /100 | #218 | Tragic 13.3% |
| Immigrants | Cambodia | 3.0 /100 | #219 | Tragic 13.4% |
| Americans | 2.9 /100 | #220 | Tragic 13.4% |
| Alsatians | 2.6 /100 | #221 | Tragic 13.4% |
| Immigrants | Micronesia | 2.6 /100 | #222 | Tragic 13.4% |
| Immigrants | Africa | 2.5 /100 | #223 | Tragic 13.4% |
| Immigrants | Eritrea | 2.4 /100 | #224 | Tragic 13.4% |
| German Russians | 2.2 /100 | #225 | Tragic 13.4% |
| Marshallese | 2.2 /100 | #226 | Tragic 13.4% |
| Alaska Natives | 2.1 /100 | #227 | Tragic 13.5% |