Immigrants from El Salvador vs Iraqi Poverty
COMPARE
Immigrants from El Salvador
Iraqi
Poverty
Poverty Comparison
Immigrants from El Salvador
Iraqis
14.3%
POVERTY
0.1/ 100
METRIC RATING
254th/ 347
METRIC RANK
12.7%
POVERTY
20.8/ 100
METRIC RATING
196th/ 347
METRIC RANK
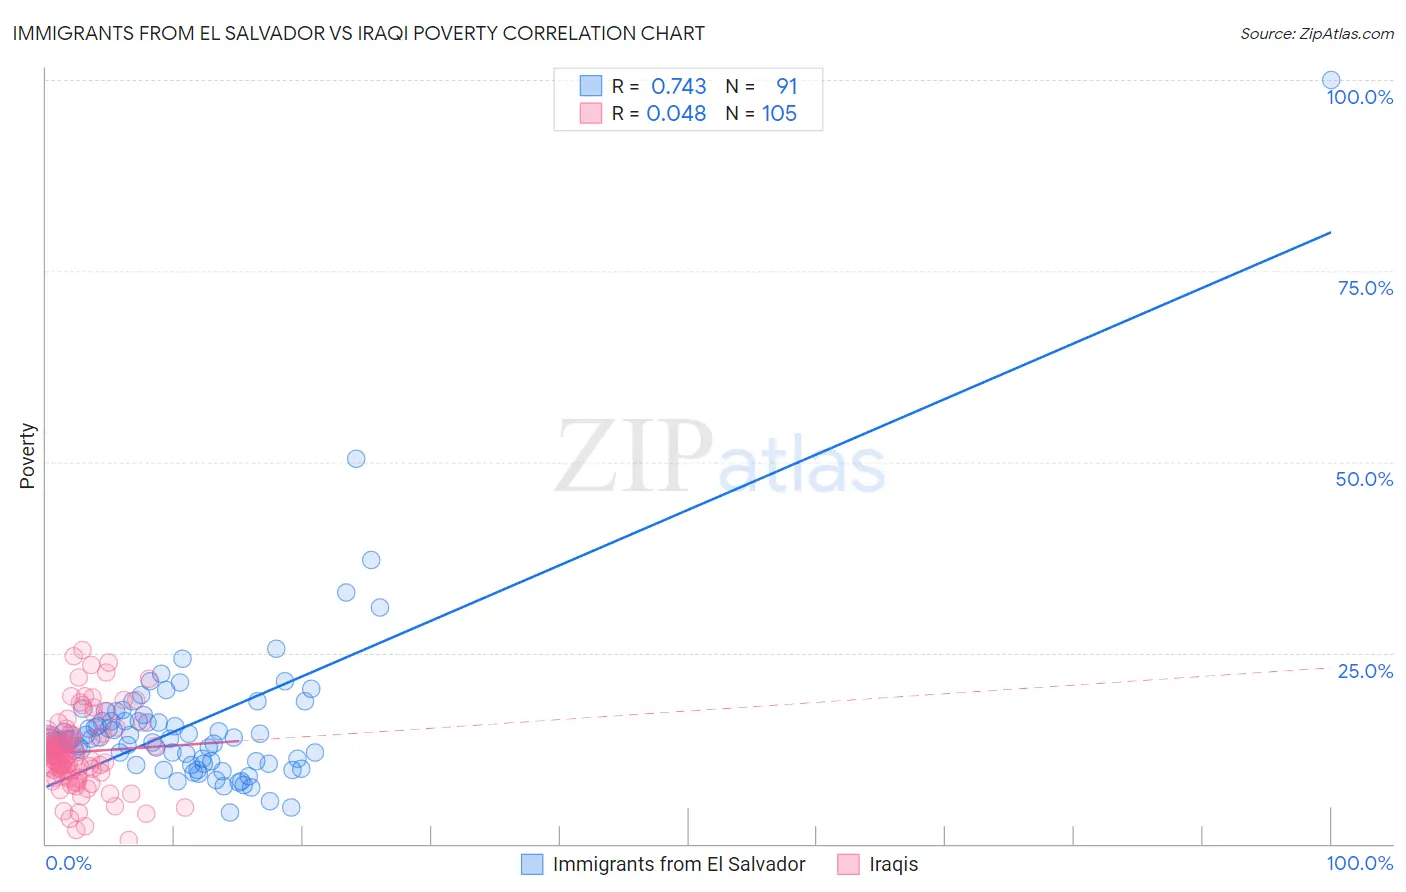
Immigrants from El Salvador vs Iraqi Poverty Correlation Chart
The statistical analysis conducted on geographies consisting of 357,703,291 people shows a strong positive correlation between the proportion of Immigrants from El Salvador and poverty level in the United States with a correlation coefficient (R) of 0.743 and weighted average of 14.3%. Similarly, the statistical analysis conducted on geographies consisting of 170,596,700 people shows no correlation between the proportion of Iraqis and poverty level in the United States with a correlation coefficient (R) of 0.048 and weighted average of 12.7%, a difference of 12.3%.
Poverty Correlation Summary
| Measurement | Immigrants from El Salvador | Iraqi |
| Minimum | 4.1% | 0.47% |
| Maximum | 100.0% | 25.4% |
| Range | 95.9% | 25.0% |
| Mean | 15.6% | 12.0% |
| Median | 13.5% | 11.5% |
| Interquartile 25% (IQ1) | 10.8% | 9.4% |
| Interquartile 75% (IQ3) | 16.1% | 14.2% |
| Interquartile Range (IQR) | 5.3% | 4.8% |
| Standard Deviation (Sample) | 11.2% | 4.9% |
| Standard Deviation (Population) | 11.1% | 4.9% |
Similar Demographics by Poverty
Demographics Similar to Immigrants from El Salvador by Poverty
In terms of poverty, the demographic groups most similar to Immigrants from El Salvador are Immigrants from Ecuador (14.3%, a difference of 0.10%), Mexican American Indian (14.3%, a difference of 0.11%), Trinidadian and Tobagonian (14.3%, a difference of 0.16%), Ottawa (14.3%, a difference of 0.17%), and Immigrants from Trinidad and Tobago (14.2%, a difference of 0.25%).
| Demographics | Rating | Rank | Poverty |
| Liberians | 0.2 /100 | #247 | Tragic 14.1% |
| Immigrants | Western Africa | 0.2 /100 | #248 | Tragic 14.1% |
| Immigrants | Ghana | 0.2 /100 | #249 | Tragic 14.2% |
| Cree | 0.2 /100 | #250 | Tragic 14.2% |
| Immigrants | Burma/Myanmar | 0.2 /100 | #251 | Tragic 14.2% |
| Spanish American Indians | 0.2 /100 | #252 | Tragic 14.2% |
| Immigrants | Trinidad and Tobago | 0.2 /100 | #253 | Tragic 14.2% |
| Immigrants | El Salvador | 0.1 /100 | #254 | Tragic 14.3% |
| Immigrants | Ecuador | 0.1 /100 | #255 | Tragic 14.3% |
| Mexican American Indians | 0.1 /100 | #256 | Tragic 14.3% |
| Trinidadians and Tobagonians | 0.1 /100 | #257 | Tragic 14.3% |
| Ottawa | 0.1 /100 | #258 | Tragic 14.3% |
| Immigrants | Nicaragua | 0.1 /100 | #259 | Tragic 14.3% |
| Cape Verdeans | 0.1 /100 | #260 | Tragic 14.4% |
| Cherokee | 0.1 /100 | #261 | Tragic 14.4% |
Demographics Similar to Iraqis by Poverty
In terms of poverty, the demographic groups most similar to Iraqis are Immigrants from Kuwait (12.7%, a difference of 0.020%), Arab (12.7%, a difference of 0.050%), Delaware (12.7%, a difference of 0.090%), Immigrants from Lebanon (12.8%, a difference of 0.31%), and Spanish (12.8%, a difference of 0.31%).
| Demographics | Rating | Rank | Poverty |
| Aleuts | 33.2 /100 | #189 | Fair 12.5% |
| Immigrants | South America | 32.3 /100 | #190 | Fair 12.5% |
| Sierra Leoneans | 31.5 /100 | #191 | Fair 12.6% |
| South American Indians | 23.3 /100 | #192 | Fair 12.7% |
| Delaware | 21.4 /100 | #193 | Fair 12.7% |
| Arabs | 21.1 /100 | #194 | Fair 12.7% |
| Immigrants | Kuwait | 20.9 /100 | #195 | Fair 12.7% |
| Iraqis | 20.8 /100 | #196 | Fair 12.7% |
| Immigrants | Lebanon | 18.7 /100 | #197 | Poor 12.8% |
| Spanish | 18.7 /100 | #198 | Poor 12.8% |
| Immigrants | Kenya | 17.5 /100 | #199 | Poor 12.8% |
| Spaniards | 16.5 /100 | #200 | Poor 12.8% |
| Immigrants | Uganda | 16.5 /100 | #201 | Poor 12.8% |
| Immigrants | Uruguay | 15.6 /100 | #202 | Poor 12.8% |
| Hmong | 15.0 /100 | #203 | Poor 12.8% |