Immigrants from El Salvador vs Icelander Poverty
COMPARE
Immigrants from El Salvador
Icelander
Poverty
Poverty Comparison
Immigrants from El Salvador
Icelanders
14.3%
POVERTY
0.1/ 100
METRIC RATING
254th/ 347
METRIC RANK
11.9%
POVERTY
77.9/ 100
METRIC RATING
144th/ 347
METRIC RANK
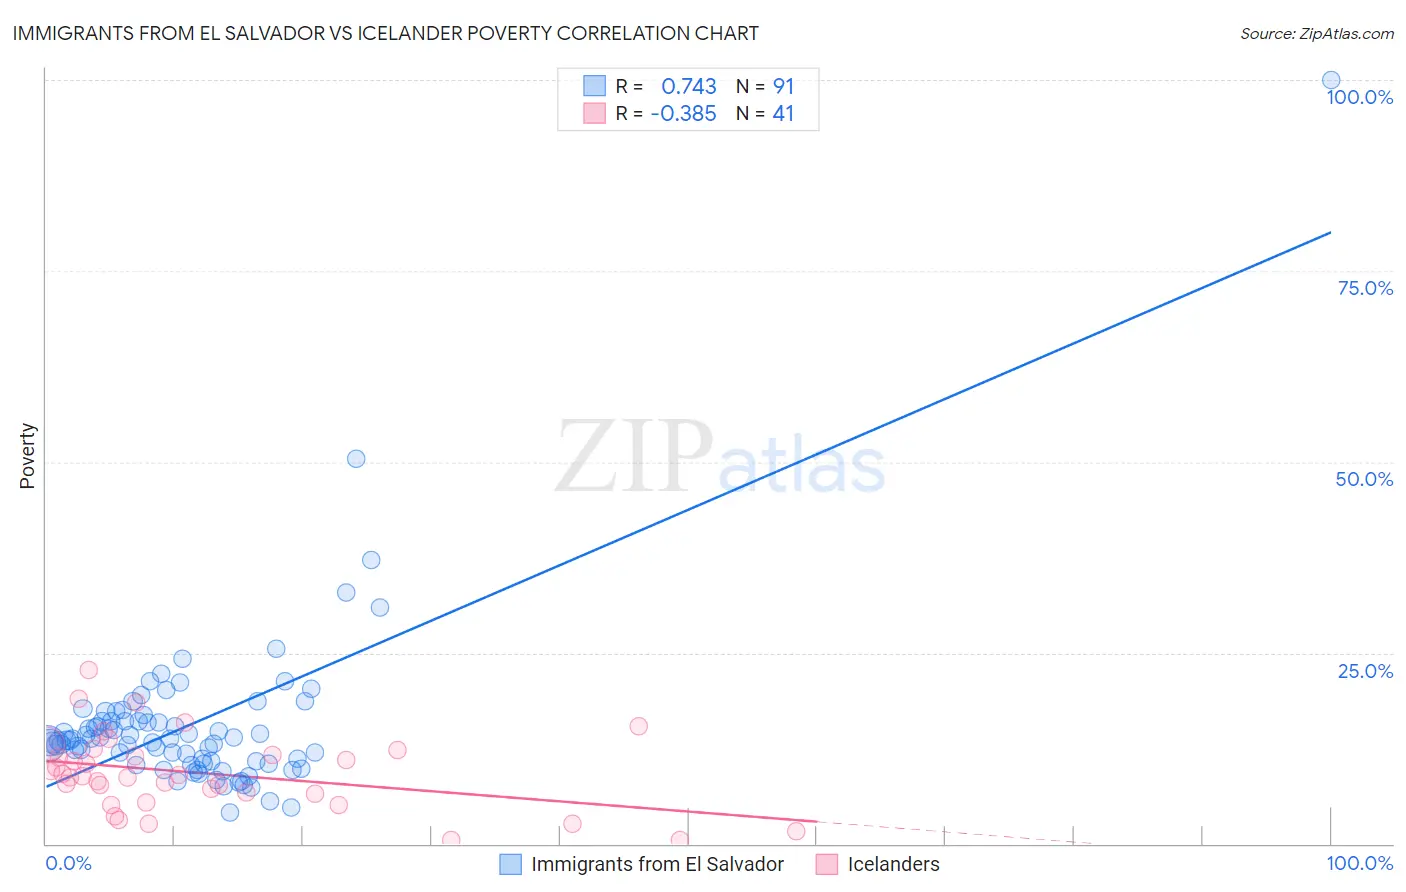
Immigrants from El Salvador vs Icelander Poverty Correlation Chart
The statistical analysis conducted on geographies consisting of 357,703,291 people shows a strong positive correlation between the proportion of Immigrants from El Salvador and poverty level in the United States with a correlation coefficient (R) of 0.743 and weighted average of 14.3%. Similarly, the statistical analysis conducted on geographies consisting of 159,621,690 people shows a mild negative correlation between the proportion of Icelanders and poverty level in the United States with a correlation coefficient (R) of -0.385 and weighted average of 11.9%, a difference of 19.6%.
Poverty Correlation Summary
| Measurement | Immigrants from El Salvador | Icelander |
| Minimum | 4.1% | 0.44% |
| Maximum | 100.0% | 22.8% |
| Range | 95.9% | 22.4% |
| Mean | 15.6% | 9.2% |
| Median | 13.5% | 8.9% |
| Interquartile 25% (IQ1) | 10.8% | 5.9% |
| Interquartile 75% (IQ3) | 16.1% | 12.0% |
| Interquartile Range (IQR) | 5.3% | 6.0% |
| Standard Deviation (Sample) | 11.2% | 5.0% |
| Standard Deviation (Population) | 11.1% | 4.9% |
Similar Demographics by Poverty
Demographics Similar to Immigrants from El Salvador by Poverty
In terms of poverty, the demographic groups most similar to Immigrants from El Salvador are Immigrants from Ecuador (14.3%, a difference of 0.10%), Mexican American Indian (14.3%, a difference of 0.11%), Trinidadian and Tobagonian (14.3%, a difference of 0.16%), Ottawa (14.3%, a difference of 0.17%), and Immigrants from Trinidad and Tobago (14.2%, a difference of 0.25%).
| Demographics | Rating | Rank | Poverty |
| Liberians | 0.2 /100 | #247 | Tragic 14.1% |
| Immigrants | Western Africa | 0.2 /100 | #248 | Tragic 14.1% |
| Immigrants | Ghana | 0.2 /100 | #249 | Tragic 14.2% |
| Cree | 0.2 /100 | #250 | Tragic 14.2% |
| Immigrants | Burma/Myanmar | 0.2 /100 | #251 | Tragic 14.2% |
| Spanish American Indians | 0.2 /100 | #252 | Tragic 14.2% |
| Immigrants | Trinidad and Tobago | 0.2 /100 | #253 | Tragic 14.2% |
| Immigrants | El Salvador | 0.1 /100 | #254 | Tragic 14.3% |
| Immigrants | Ecuador | 0.1 /100 | #255 | Tragic 14.3% |
| Mexican American Indians | 0.1 /100 | #256 | Tragic 14.3% |
| Trinidadians and Tobagonians | 0.1 /100 | #257 | Tragic 14.3% |
| Ottawa | 0.1 /100 | #258 | Tragic 14.3% |
| Immigrants | Nicaragua | 0.1 /100 | #259 | Tragic 14.3% |
| Cape Verdeans | 0.1 /100 | #260 | Tragic 14.4% |
| Cherokee | 0.1 /100 | #261 | Tragic 14.4% |
Demographics Similar to Icelanders by Poverty
In terms of poverty, the demographic groups most similar to Icelanders are Brazilian (11.9%, a difference of 0.27%), Basque (11.9%, a difference of 0.38%), Syrian (12.0%, a difference of 0.38%), Immigrants from France (11.9%, a difference of 0.40%), and Afghan (12.0%, a difference of 0.42%).
| Demographics | Rating | Rank | Poverty |
| Immigrants | Switzerland | 83.0 /100 | #137 | Excellent 11.8% |
| Immigrants | Jordan | 82.4 /100 | #138 | Excellent 11.9% |
| Pakistanis | 82.2 /100 | #139 | Excellent 11.9% |
| Immigrants | Peru | 81.1 /100 | #140 | Excellent 11.9% |
| Immigrants | France | 80.5 /100 | #141 | Excellent 11.9% |
| Basques | 80.4 /100 | #142 | Excellent 11.9% |
| Brazilians | 79.7 /100 | #143 | Good 11.9% |
| Icelanders | 77.9 /100 | #144 | Good 11.9% |
| Syrians | 75.1 /100 | #145 | Good 12.0% |
| Afghans | 74.9 /100 | #146 | Good 12.0% |
| Immigrants | Bosnia and Herzegovina | 73.7 /100 | #147 | Good 12.0% |
| Immigrants | Germany | 72.7 /100 | #148 | Good 12.0% |
| Immigrants | Malaysia | 72.7 /100 | #149 | Good 12.0% |
| Immigrants | Kazakhstan | 72.3 /100 | #150 | Good 12.0% |
| Samoans | 71.9 /100 | #151 | Good 12.0% |