Immigrants from Egypt vs Guyanese Female Poverty
COMPARE
Immigrants from Egypt
Guyanese
Female Poverty
Female Poverty Comparison
Immigrants from Egypt
Guyanese
12.5%
FEMALE POVERTY
95.5/ 100
METRIC RATING
93rd/ 347
METRIC RANK
15.6%
FEMALE POVERTY
0.1/ 100
METRIC RATING
261st/ 347
METRIC RANK
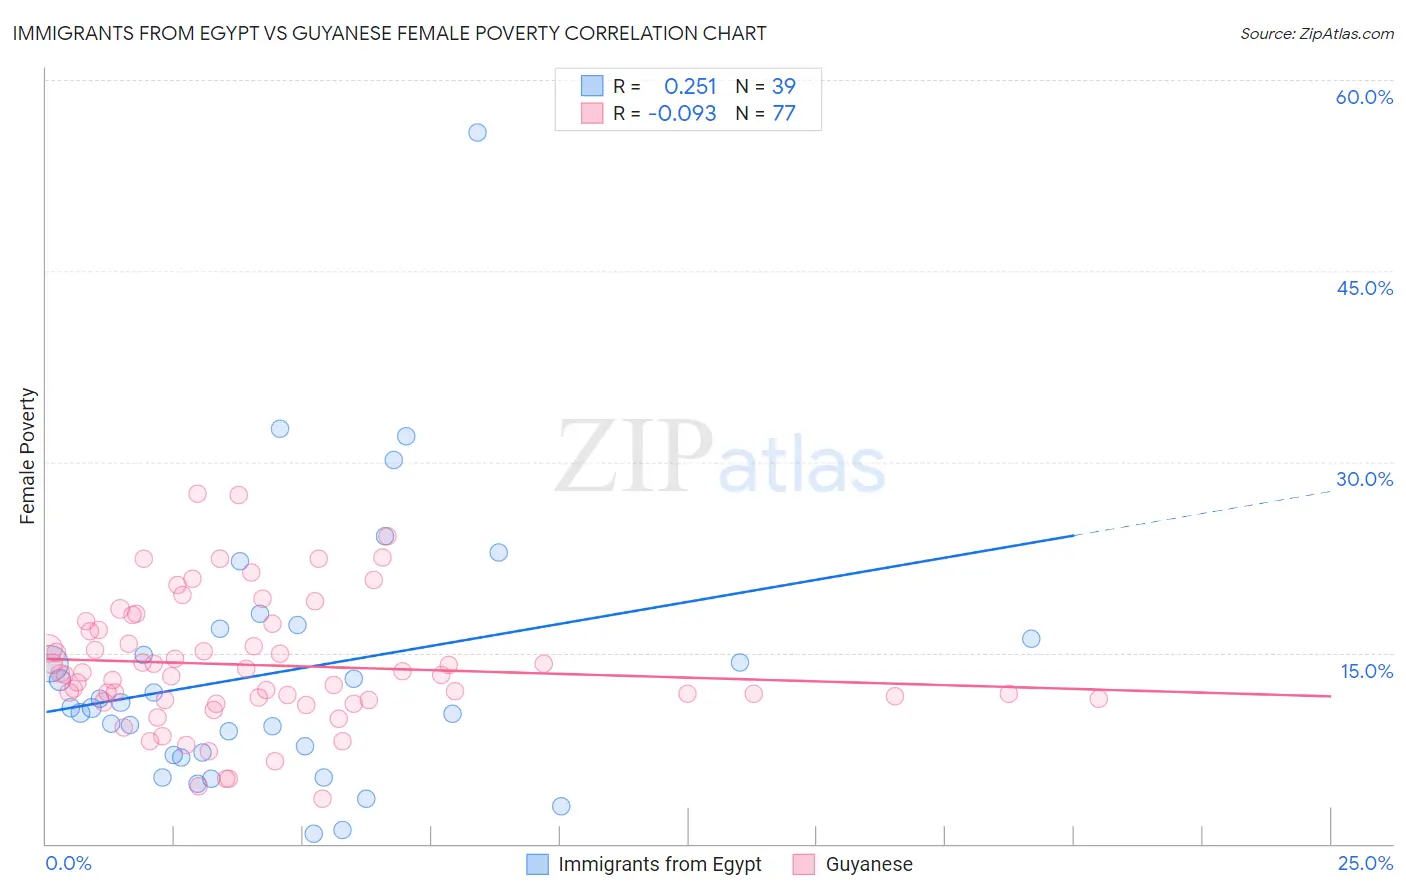
Immigrants from Egypt vs Guyanese Female Poverty Correlation Chart
The statistical analysis conducted on geographies consisting of 245,387,558 people shows a weak positive correlation between the proportion of Immigrants from Egypt and poverty level among females in the United States with a correlation coefficient (R) of 0.251 and weighted average of 12.5%. Similarly, the statistical analysis conducted on geographies consisting of 176,777,611 people shows a slight negative correlation between the proportion of Guyanese and poverty level among females in the United States with a correlation coefficient (R) of -0.093 and weighted average of 15.6%, a difference of 25.3%.
Female Poverty Correlation Summary
| Measurement | Immigrants from Egypt | Guyanese |
| Minimum | 0.78% | 3.5% |
| Maximum | 55.9% | 27.5% |
| Range | 55.1% | 24.0% |
| Mean | 13.5% | 14.0% |
| Median | 10.7% | 13.3% |
| Interquartile 25% (IQ1) | 7.0% | 11.3% |
| Interquartile 75% (IQ3) | 16.9% | 17.1% |
| Interquartile Range (IQR) | 9.9% | 5.7% |
| Standard Deviation (Sample) | 10.5% | 5.0% |
| Standard Deviation (Population) | 10.4% | 5.0% |
Similar Demographics by Female Poverty
Demographics Similar to Immigrants from Egypt by Female Poverty
In terms of female poverty, the demographic groups most similar to Immigrants from Egypt are Immigrants from Indonesia (12.5%, a difference of 0.030%), Immigrants from South Africa (12.5%, a difference of 0.070%), British (12.5%, a difference of 0.14%), Czechoslovakian (12.4%, a difference of 0.17%), and Australian (12.5%, a difference of 0.17%).
| Demographics | Rating | Rank | Female Poverty |
| Dutch | 96.5 /100 | #86 | Exceptional 12.4% |
| Okinawans | 96.4 /100 | #87 | Exceptional 12.4% |
| Finns | 96.4 /100 | #88 | Exceptional 12.4% |
| English | 96.1 /100 | #89 | Exceptional 12.4% |
| Immigrants | Denmark | 95.8 /100 | #90 | Exceptional 12.4% |
| Belgians | 95.8 /100 | #91 | Exceptional 12.4% |
| Czechoslovakians | 95.7 /100 | #92 | Exceptional 12.4% |
| Immigrants | Egypt | 95.5 /100 | #93 | Exceptional 12.5% |
| Immigrants | Indonesia | 95.4 /100 | #94 | Exceptional 12.5% |
| Immigrants | South Africa | 95.4 /100 | #95 | Exceptional 12.5% |
| British | 95.2 /100 | #96 | Exceptional 12.5% |
| Australians | 95.2 /100 | #97 | Exceptional 12.5% |
| Native Hawaiians | 95.1 /100 | #98 | Exceptional 12.5% |
| Romanians | 95.1 /100 | #99 | Exceptional 12.5% |
| Immigrants | Latvia | 94.8 /100 | #100 | Exceptional 12.5% |
Demographics Similar to Guyanese by Female Poverty
In terms of female poverty, the demographic groups most similar to Guyanese are Mexican American Indian (15.6%, a difference of 0.0%), Cherokee (15.6%, a difference of 0.010%), Immigrants from Guyana (15.6%, a difference of 0.10%), Immigrants from Ecuador (15.6%, a difference of 0.14%), and Cape Verdean (15.6%, a difference of 0.18%).
| Demographics | Rating | Rank | Female Poverty |
| Trinidadians and Tobagonians | 0.2 /100 | #254 | Tragic 15.4% |
| Ottawa | 0.2 /100 | #255 | Tragic 15.5% |
| Jamaicans | 0.2 /100 | #256 | Tragic 15.5% |
| Immigrants | Jamaica | 0.1 /100 | #257 | Tragic 15.6% |
| Shoshone | 0.1 /100 | #258 | Tragic 15.6% |
| Cape Verdeans | 0.1 /100 | #259 | Tragic 15.6% |
| Immigrants | Guyana | 0.1 /100 | #260 | Tragic 15.6% |
| Guyanese | 0.1 /100 | #261 | Tragic 15.6% |
| Mexican American Indians | 0.1 /100 | #262 | Tragic 15.6% |
| Cherokee | 0.1 /100 | #263 | Tragic 15.6% |
| Immigrants | Ecuador | 0.1 /100 | #264 | Tragic 15.6% |
| Immigrants | Liberia | 0.1 /100 | #265 | Tragic 15.7% |
| Immigrants | El Salvador | 0.1 /100 | #266 | Tragic 15.7% |
| Sub-Saharan Africans | 0.1 /100 | #267 | Tragic 15.8% |
| Immigrants | Nicaragua | 0.1 /100 | #268 | Tragic 15.8% |