Immigrants from Egypt vs Guyanese Disability Age 35 to 64
COMPARE
Immigrants from Egypt
Guyanese
Disability Age 35 to 64
Disability Age 35 to 64 Comparison
Immigrants from Egypt
Guyanese
9.8%
DISABILITY AGE 35 TO 64
99.9/ 100
METRIC RATING
44th/ 347
METRIC RANK
11.0%
DISABILITY AGE 35 TO 64
75.1/ 100
METRIC RATING
157th/ 347
METRIC RANK
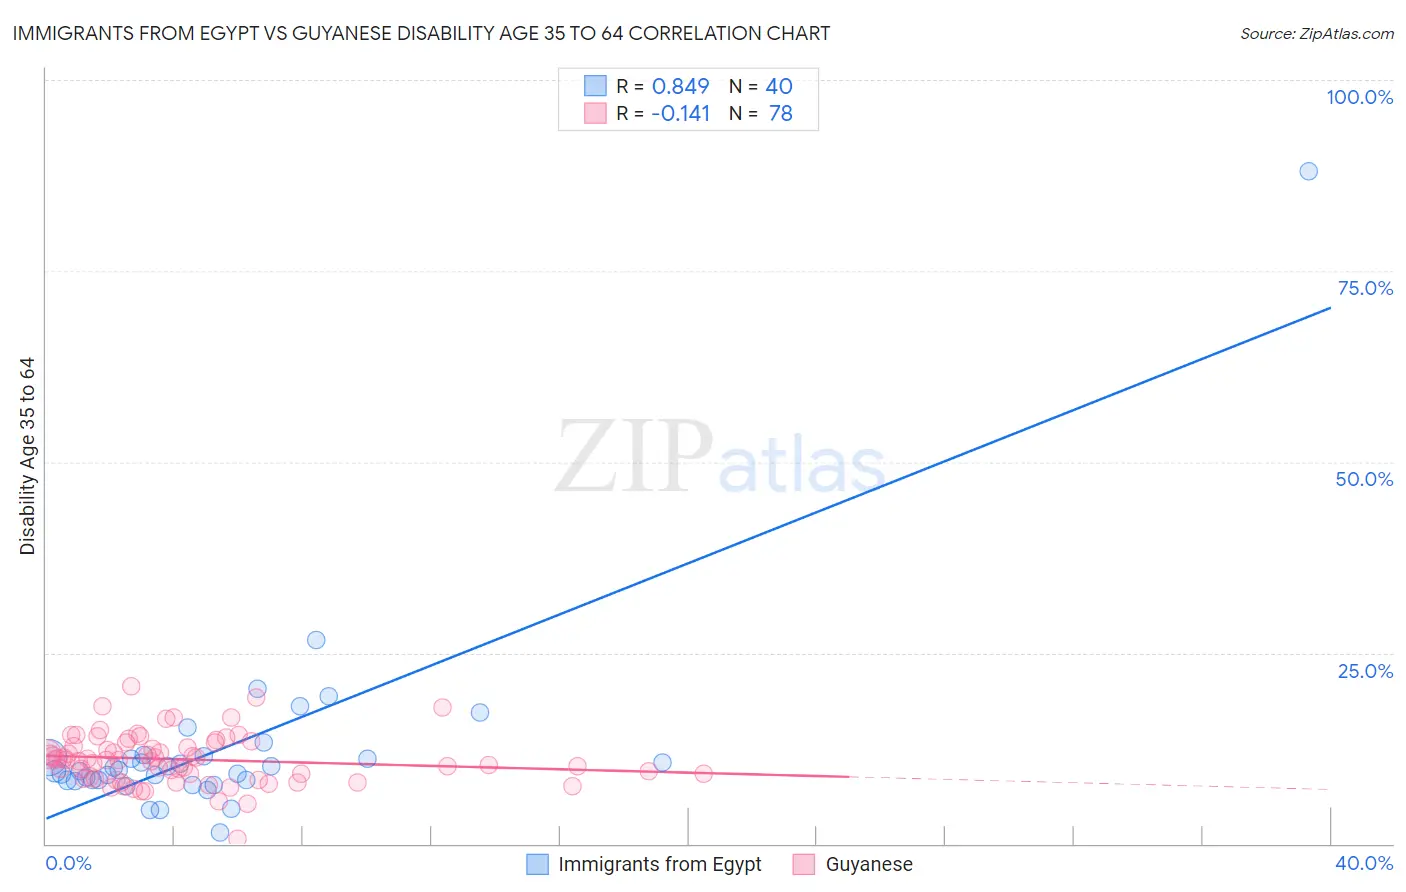
Immigrants from Egypt vs Guyanese Disability Age 35 to 64 Correlation Chart
The statistical analysis conducted on geographies consisting of 245,410,739 people shows a very strong positive correlation between the proportion of Immigrants from Egypt and percentage of population with a disability between the ages 34 and 64 in the United States with a correlation coefficient (R) of 0.849 and weighted average of 9.8%. Similarly, the statistical analysis conducted on geographies consisting of 176,764,315 people shows a poor negative correlation between the proportion of Guyanese and percentage of population with a disability between the ages 34 and 64 in the United States with a correlation coefficient (R) of -0.141 and weighted average of 11.0%, a difference of 12.6%.
Disability Age 35 to 64 Correlation Summary
| Measurement | Immigrants from Egypt | Guyanese |
| Minimum | 1.5% | 0.73% |
| Maximum | 88.0% | 20.7% |
| Range | 86.5% | 19.9% |
| Mean | 12.4% | 11.0% |
| Median | 9.6% | 10.9% |
| Interquartile 25% (IQ1) | 8.3% | 8.5% |
| Interquartile 75% (IQ3) | 11.4% | 13.3% |
| Interquartile Range (IQR) | 3.0% | 4.8% |
| Standard Deviation (Sample) | 13.1% | 3.3% |
| Standard Deviation (Population) | 12.9% | 3.3% |
Similar Demographics by Disability Age 35 to 64
Demographics Similar to Immigrants from Egypt by Disability Age 35 to 64
In terms of disability age 35 to 64, the demographic groups most similar to Immigrants from Egypt are Immigrants from Peru (9.8%, a difference of 0.060%), Cambodian (9.8%, a difference of 0.25%), Immigrants from Colombia (9.8%, a difference of 0.29%), Immigrants from Belgium (9.8%, a difference of 0.30%), and Immigrants from Serbia (9.8%, a difference of 0.31%).
| Demographics | Rating | Rank | Disability Age 35 to 64 |
| Immigrants | Turkey | 99.9 /100 | #37 | Exceptional 9.7% |
| Egyptians | 99.9 /100 | #38 | Exceptional 9.7% |
| Immigrants | Belarus | 99.9 /100 | #39 | Exceptional 9.7% |
| Immigrants | Armenia | 99.9 /100 | #40 | Exceptional 9.7% |
| Israelis | 99.9 /100 | #41 | Exceptional 9.7% |
| Immigrants | Malaysia | 99.9 /100 | #42 | Exceptional 9.7% |
| Immigrants | Colombia | 99.9 /100 | #43 | Exceptional 9.8% |
| Immigrants | Egypt | 99.9 /100 | #44 | Exceptional 9.8% |
| Immigrants | Peru | 99.9 /100 | #45 | Exceptional 9.8% |
| Cambodians | 99.8 /100 | #46 | Exceptional 9.8% |
| Immigrants | Belgium | 99.8 /100 | #47 | Exceptional 9.8% |
| Immigrants | Serbia | 99.8 /100 | #48 | Exceptional 9.8% |
| Immigrants | Greece | 99.8 /100 | #49 | Exceptional 9.8% |
| Paraguayans | 99.8 /100 | #50 | Exceptional 9.8% |
| Bhutanese | 99.8 /100 | #51 | Exceptional 9.8% |
Demographics Similar to Guyanese by Disability Age 35 to 64
In terms of disability age 35 to 64, the demographic groups most similar to Guyanese are Immigrants from North America (11.0%, a difference of 0.010%), Immigrants from Sierra Leone (11.0%, a difference of 0.13%), Moroccan (11.0%, a difference of 0.15%), Serbian (11.0%, a difference of 0.16%), and Immigrants from Canada (11.0%, a difference of 0.19%).
| Demographics | Rating | Rank | Disability Age 35 to 64 |
| Syrians | 79.8 /100 | #150 | Good 11.0% |
| New Zealanders | 79.3 /100 | #151 | Good 11.0% |
| Ukrainians | 78.0 /100 | #152 | Good 11.0% |
| Immigrants | England | 77.4 /100 | #153 | Good 11.0% |
| Immigrants | Canada | 76.7 /100 | #154 | Good 11.0% |
| Moroccans | 76.4 /100 | #155 | Good 11.0% |
| Immigrants | Sierra Leone | 76.2 /100 | #156 | Good 11.0% |
| Guyanese | 75.1 /100 | #157 | Good 11.0% |
| Immigrants | North America | 74.9 /100 | #158 | Good 11.0% |
| Serbians | 73.6 /100 | #159 | Good 11.0% |
| Croatians | 73.1 /100 | #160 | Good 11.0% |
| Immigrants | Guyana | 70.1 /100 | #161 | Good 11.1% |
| Immigrants | Grenada | 68.4 /100 | #162 | Good 11.1% |
| Immigrants | St. Vincent and the Grenadines | 66.6 /100 | #163 | Good 11.1% |
| Pakistanis | 65.8 /100 | #164 | Good 11.1% |