Syrian vs Guyanese Female Poverty
COMPARE
Syrian
Guyanese
Female Poverty
Female Poverty Comparison
Syrians
Guyanese
13.0%
FEMALE POVERTY
79.6/ 100
METRIC RATING
145th/ 347
METRIC RANK
15.6%
FEMALE POVERTY
0.1/ 100
METRIC RATING
261st/ 347
METRIC RANK
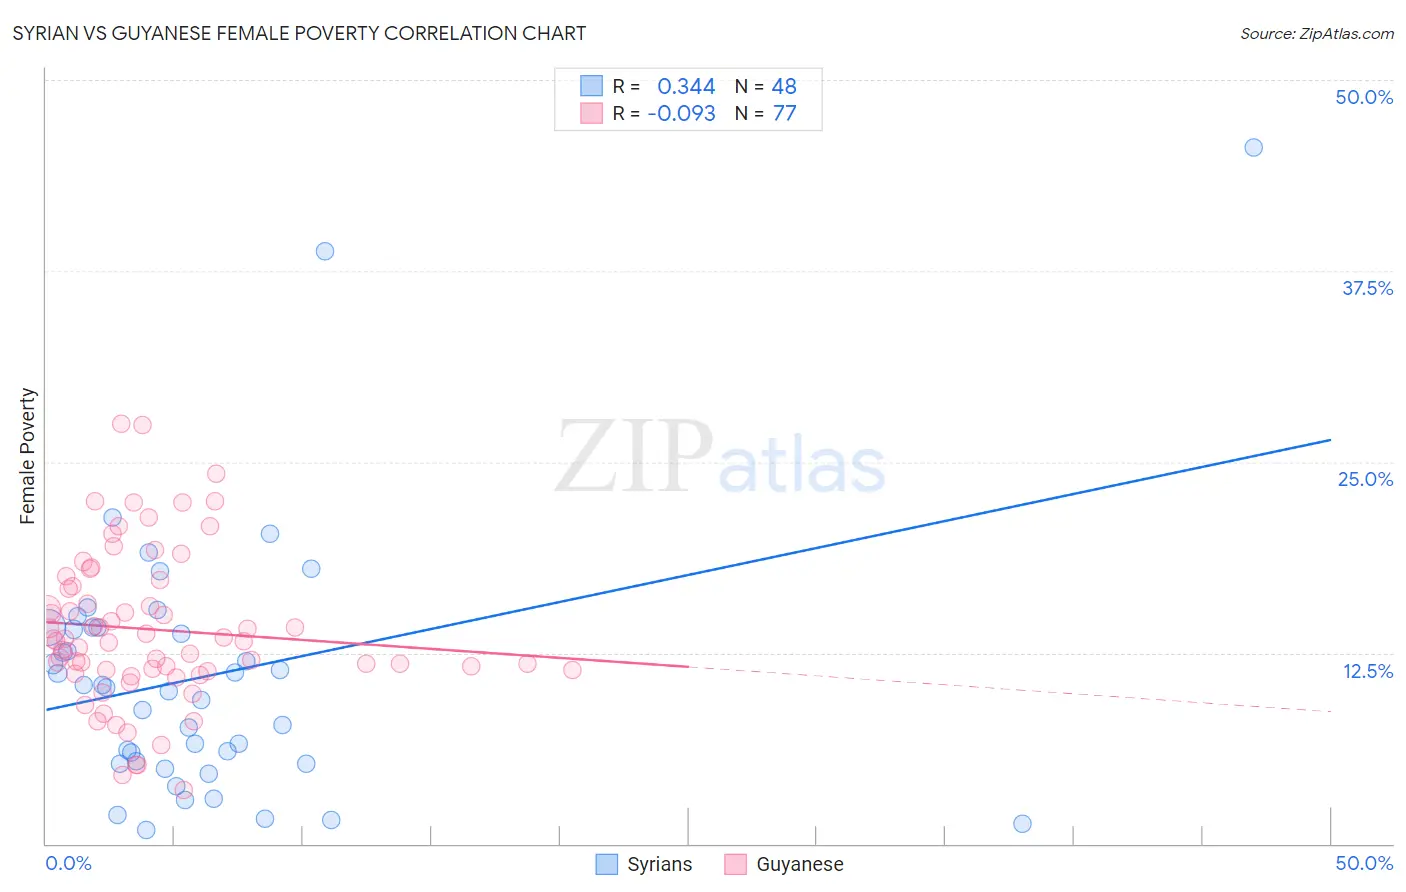
Syrian vs Guyanese Female Poverty Correlation Chart
The statistical analysis conducted on geographies consisting of 266,159,377 people shows a mild positive correlation between the proportion of Syrians and poverty level among females in the United States with a correlation coefficient (R) of 0.344 and weighted average of 13.0%. Similarly, the statistical analysis conducted on geographies consisting of 176,777,611 people shows a slight negative correlation between the proportion of Guyanese and poverty level among females in the United States with a correlation coefficient (R) of -0.093 and weighted average of 15.6%, a difference of 20.1%.
Female Poverty Correlation Summary
| Measurement | Syrian | Guyanese |
| Minimum | 0.87% | 3.5% |
| Maximum | 45.6% | 27.5% |
| Range | 44.7% | 24.0% |
| Mean | 11.0% | 14.0% |
| Median | 10.3% | 13.3% |
| Interquartile 25% (IQ1) | 5.3% | 11.3% |
| Interquartile 75% (IQ3) | 14.1% | 17.1% |
| Interquartile Range (IQR) | 8.8% | 5.7% |
| Standard Deviation (Sample) | 8.5% | 5.0% |
| Standard Deviation (Population) | 8.4% | 5.0% |
Similar Demographics by Female Poverty
Demographics Similar to Syrians by Female Poverty
In terms of female poverty, the demographic groups most similar to Syrians are Afghan (13.0%, a difference of 0.030%), Immigrants from Peru (13.0%, a difference of 0.080%), Immigrants from Malaysia (13.0%, a difference of 0.12%), Brazilian (13.0%, a difference of 0.14%), and Immigrants from Kazakhstan (13.0%, a difference of 0.16%).
| Demographics | Rating | Rank | Female Poverty |
| Immigrants | France | 83.6 /100 | #138 | Excellent 12.9% |
| Basques | 83.1 /100 | #139 | Excellent 12.9% |
| Pakistanis | 83.0 /100 | #140 | Excellent 12.9% |
| Icelanders | 81.1 /100 | #141 | Excellent 13.0% |
| Brazilians | 80.5 /100 | #142 | Excellent 13.0% |
| Immigrants | Malaysia | 80.4 /100 | #143 | Excellent 13.0% |
| Afghans | 79.8 /100 | #144 | Good 13.0% |
| Syrians | 79.6 /100 | #145 | Good 13.0% |
| Immigrants | Peru | 79.1 /100 | #146 | Good 13.0% |
| Immigrants | Kazakhstan | 78.6 /100 | #147 | Good 13.0% |
| Yugoslavians | 76.9 /100 | #148 | Good 13.1% |
| Taiwanese | 75.7 /100 | #149 | Good 13.1% |
| Tsimshian | 75.5 /100 | #150 | Good 13.1% |
| Immigrants | Germany | 74.9 /100 | #151 | Good 13.1% |
| Samoans | 73.6 /100 | #152 | Good 13.1% |
Demographics Similar to Guyanese by Female Poverty
In terms of female poverty, the demographic groups most similar to Guyanese are Mexican American Indian (15.6%, a difference of 0.0%), Cherokee (15.6%, a difference of 0.010%), Immigrants from Guyana (15.6%, a difference of 0.10%), Immigrants from Ecuador (15.6%, a difference of 0.14%), and Cape Verdean (15.6%, a difference of 0.18%).
| Demographics | Rating | Rank | Female Poverty |
| Trinidadians and Tobagonians | 0.2 /100 | #254 | Tragic 15.4% |
| Ottawa | 0.2 /100 | #255 | Tragic 15.5% |
| Jamaicans | 0.2 /100 | #256 | Tragic 15.5% |
| Immigrants | Jamaica | 0.1 /100 | #257 | Tragic 15.6% |
| Shoshone | 0.1 /100 | #258 | Tragic 15.6% |
| Cape Verdeans | 0.1 /100 | #259 | Tragic 15.6% |
| Immigrants | Guyana | 0.1 /100 | #260 | Tragic 15.6% |
| Guyanese | 0.1 /100 | #261 | Tragic 15.6% |
| Mexican American Indians | 0.1 /100 | #262 | Tragic 15.6% |
| Cherokee | 0.1 /100 | #263 | Tragic 15.6% |
| Immigrants | Ecuador | 0.1 /100 | #264 | Tragic 15.6% |
| Immigrants | Liberia | 0.1 /100 | #265 | Tragic 15.7% |
| Immigrants | El Salvador | 0.1 /100 | #266 | Tragic 15.7% |
| Sub-Saharan Africans | 0.1 /100 | #267 | Tragic 15.8% |
| Immigrants | Nicaragua | 0.1 /100 | #268 | Tragic 15.8% |