Immigrants from Egypt vs Cambodian Female Poverty
COMPARE
Immigrants from Egypt
Cambodian
Female Poverty
Female Poverty Comparison
Immigrants from Egypt
Cambodians
12.5%
FEMALE POVERTY
95.5/ 100
METRIC RATING
93rd/ 347
METRIC RANK
12.2%
FEMALE POVERTY
97.5/ 100
METRIC RATING
72nd/ 347
METRIC RANK
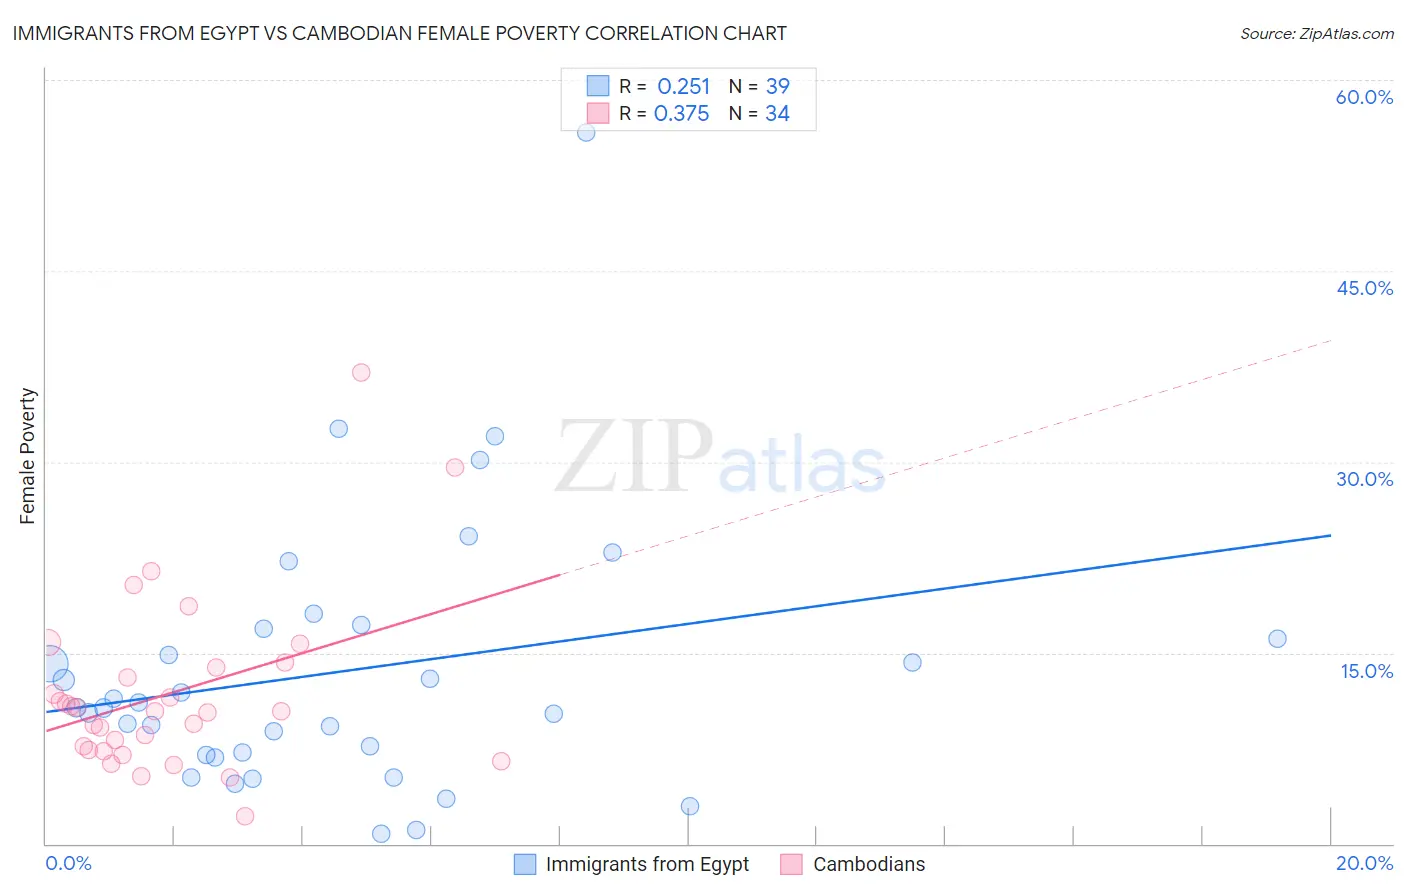
Immigrants from Egypt vs Cambodian Female Poverty Correlation Chart
The statistical analysis conducted on geographies consisting of 245,387,558 people shows a weak positive correlation between the proportion of Immigrants from Egypt and poverty level among females in the United States with a correlation coefficient (R) of 0.251 and weighted average of 12.5%. Similarly, the statistical analysis conducted on geographies consisting of 102,481,907 people shows a mild positive correlation between the proportion of Cambodians and poverty level among females in the United States with a correlation coefficient (R) of 0.375 and weighted average of 12.2%, a difference of 1.7%.
Female Poverty Correlation Summary
| Measurement | Immigrants from Egypt | Cambodian |
| Minimum | 0.78% | 2.1% |
| Maximum | 55.9% | 37.0% |
| Range | 55.1% | 34.9% |
| Mean | 13.5% | 11.9% |
| Median | 10.7% | 10.4% |
| Interquartile 25% (IQ1) | 7.0% | 7.3% |
| Interquartile 75% (IQ3) | 16.9% | 13.9% |
| Interquartile Range (IQR) | 9.9% | 6.5% |
| Standard Deviation (Sample) | 10.5% | 7.0% |
| Standard Deviation (Population) | 10.4% | 6.9% |
Similar Demographics by Female Poverty
Demographics Similar to Immigrants from Egypt by Female Poverty
In terms of female poverty, the demographic groups most similar to Immigrants from Egypt are Immigrants from Indonesia (12.5%, a difference of 0.030%), Immigrants from South Africa (12.5%, a difference of 0.070%), British (12.5%, a difference of 0.14%), Czechoslovakian (12.4%, a difference of 0.17%), and Australian (12.5%, a difference of 0.17%).
| Demographics | Rating | Rank | Female Poverty |
| Dutch | 96.5 /100 | #86 | Exceptional 12.4% |
| Okinawans | 96.4 /100 | #87 | Exceptional 12.4% |
| Finns | 96.4 /100 | #88 | Exceptional 12.4% |
| English | 96.1 /100 | #89 | Exceptional 12.4% |
| Immigrants | Denmark | 95.8 /100 | #90 | Exceptional 12.4% |
| Belgians | 95.8 /100 | #91 | Exceptional 12.4% |
| Czechoslovakians | 95.7 /100 | #92 | Exceptional 12.4% |
| Immigrants | Egypt | 95.5 /100 | #93 | Exceptional 12.5% |
| Immigrants | Indonesia | 95.4 /100 | #94 | Exceptional 12.5% |
| Immigrants | South Africa | 95.4 /100 | #95 | Exceptional 12.5% |
| British | 95.2 /100 | #96 | Exceptional 12.5% |
| Australians | 95.2 /100 | #97 | Exceptional 12.5% |
| Native Hawaiians | 95.1 /100 | #98 | Exceptional 12.5% |
| Romanians | 95.1 /100 | #99 | Exceptional 12.5% |
| Immigrants | Latvia | 94.8 /100 | #100 | Exceptional 12.5% |
Demographics Similar to Cambodians by Female Poverty
In terms of female poverty, the demographic groups most similar to Cambodians are Zimbabwean (12.3%, a difference of 0.020%), Carpatho Rusyn (12.2%, a difference of 0.030%), Immigrants from Canada (12.3%, a difference of 0.030%), European (12.3%, a difference of 0.15%), and Immigrants from Belgium (12.2%, a difference of 0.16%).
| Demographics | Rating | Rank | Female Poverty |
| Indians (Asian) | 97.9 /100 | #65 | Exceptional 12.2% |
| Austrians | 97.9 /100 | #66 | Exceptional 12.2% |
| Immigrants | Eastern Asia | 97.8 /100 | #67 | Exceptional 12.2% |
| Immigrants | Netherlands | 97.8 /100 | #68 | Exceptional 12.2% |
| Swiss | 97.7 /100 | #69 | Exceptional 12.2% |
| Immigrants | Belgium | 97.7 /100 | #70 | Exceptional 12.2% |
| Carpatho Rusyns | 97.6 /100 | #71 | Exceptional 12.2% |
| Cambodians | 97.5 /100 | #72 | Exceptional 12.2% |
| Zimbabweans | 97.5 /100 | #73 | Exceptional 12.3% |
| Immigrants | Canada | 97.5 /100 | #74 | Exceptional 12.3% |
| Europeans | 97.4 /100 | #75 | Exceptional 12.3% |
| Immigrants | Eastern Europe | 97.2 /100 | #76 | Exceptional 12.3% |
| Serbians | 97.2 /100 | #77 | Exceptional 12.3% |
| Egyptians | 97.2 /100 | #78 | Exceptional 12.3% |
| Immigrants | North America | 97.1 /100 | #79 | Exceptional 12.3% |