Immigrants from Ecuador vs Bahamian Female Poverty
COMPARE
Immigrants from Ecuador
Bahamian
Female Poverty
Female Poverty Comparison
Immigrants from Ecuador
Bahamians
15.6%
FEMALE POVERTY
0.1/ 100
METRIC RATING
264th/ 347
METRIC RANK
16.6%
FEMALE POVERTY
0.0/ 100
METRIC RATING
300th/ 347
METRIC RANK
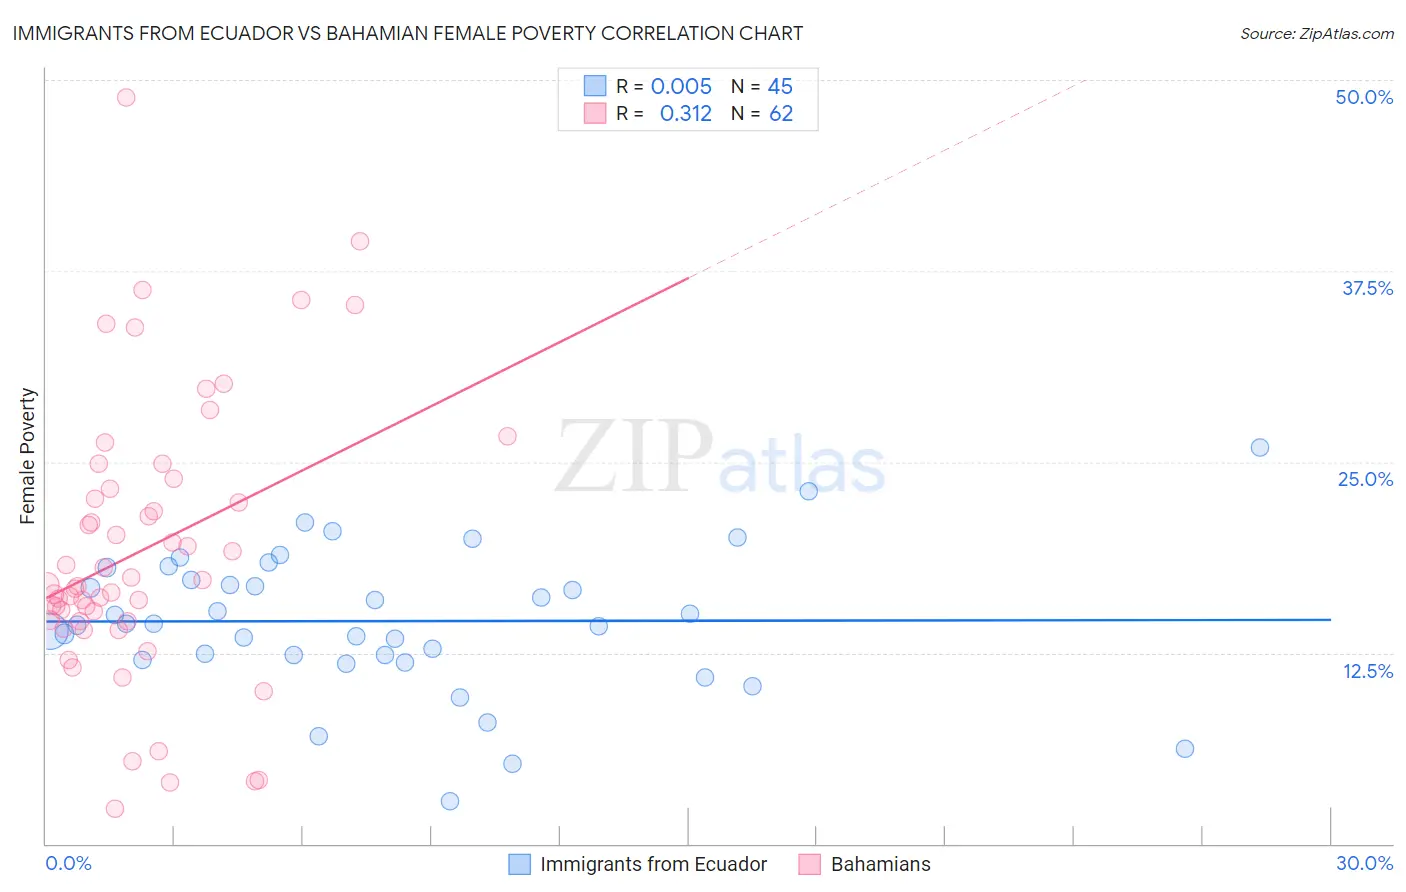
Immigrants from Ecuador vs Bahamian Female Poverty Correlation Chart
The statistical analysis conducted on geographies consisting of 270,847,702 people shows no correlation between the proportion of Immigrants from Ecuador and poverty level among females in the United States with a correlation coefficient (R) of 0.005 and weighted average of 15.6%. Similarly, the statistical analysis conducted on geographies consisting of 112,629,599 people shows a mild positive correlation between the proportion of Bahamians and poverty level among females in the United States with a correlation coefficient (R) of 0.312 and weighted average of 16.6%, a difference of 6.5%.
Female Poverty Correlation Summary
| Measurement | Immigrants from Ecuador | Bahamian |
| Minimum | 2.8% | 2.3% |
| Maximum | 25.9% | 48.8% |
| Range | 23.1% | 46.5% |
| Mean | 14.6% | 19.2% |
| Median | 14.4% | 16.9% |
| Interquartile 25% (IQ1) | 12.2% | 14.6% |
| Interquartile 75% (IQ3) | 17.7% | 23.2% |
| Interquartile Range (IQR) | 5.5% | 8.7% |
| Standard Deviation (Sample) | 4.6% | 9.1% |
| Standard Deviation (Population) | 4.6% | 9.0% |
Similar Demographics by Female Poverty
Demographics Similar to Immigrants from Ecuador by Female Poverty
In terms of female poverty, the demographic groups most similar to Immigrants from Ecuador are Cherokee (15.6%, a difference of 0.13%), Guyanese (15.6%, a difference of 0.14%), Mexican American Indian (15.6%, a difference of 0.14%), Immigrants from Guyana (15.6%, a difference of 0.24%), and Immigrants from Liberia (15.7%, a difference of 0.30%).
| Demographics | Rating | Rank | Female Poverty |
| Immigrants | Jamaica | 0.1 /100 | #257 | Tragic 15.6% |
| Shoshone | 0.1 /100 | #258 | Tragic 15.6% |
| Cape Verdeans | 0.1 /100 | #259 | Tragic 15.6% |
| Immigrants | Guyana | 0.1 /100 | #260 | Tragic 15.6% |
| Guyanese | 0.1 /100 | #261 | Tragic 15.6% |
| Mexican American Indians | 0.1 /100 | #262 | Tragic 15.6% |
| Cherokee | 0.1 /100 | #263 | Tragic 15.6% |
| Immigrants | Ecuador | 0.1 /100 | #264 | Tragic 15.6% |
| Immigrants | Liberia | 0.1 /100 | #265 | Tragic 15.7% |
| Immigrants | El Salvador | 0.1 /100 | #266 | Tragic 15.7% |
| Sub-Saharan Africans | 0.1 /100 | #267 | Tragic 15.8% |
| Immigrants | Nicaragua | 0.1 /100 | #268 | Tragic 15.8% |
| Iroquois | 0.1 /100 | #269 | Tragic 15.8% |
| Chickasaw | 0.1 /100 | #270 | Tragic 15.9% |
| Immigrants | St. Vincent and the Grenadines | 0.0 /100 | #271 | Tragic 15.9% |
Demographics Similar to Bahamians by Female Poverty
In terms of female poverty, the demographic groups most similar to Bahamians are Hispanic or Latino (16.6%, a difference of 0.040%), Guatemalan (16.7%, a difference of 0.33%), Chippewa (16.7%, a difference of 0.36%), Somali (16.6%, a difference of 0.56%), and Mexican (16.5%, a difference of 0.77%).
| Demographics | Rating | Rank | Female Poverty |
| Immigrants | Latin America | 0.0 /100 | #293 | Tragic 16.4% |
| Immigrants | Cabo Verde | 0.0 /100 | #294 | Tragic 16.4% |
| Senegalese | 0.0 /100 | #295 | Tragic 16.5% |
| Immigrants | Senegal | 0.0 /100 | #296 | Tragic 16.5% |
| Mexicans | 0.0 /100 | #297 | Tragic 16.5% |
| Somalis | 0.0 /100 | #298 | Tragic 16.6% |
| Hispanics or Latinos | 0.0 /100 | #299 | Tragic 16.6% |
| Bahamians | 0.0 /100 | #300 | Tragic 16.6% |
| Guatemalans | 0.0 /100 | #301 | Tragic 16.7% |
| Chippewa | 0.0 /100 | #302 | Tragic 16.7% |
| Choctaw | 0.0 /100 | #303 | Tragic 16.8% |
| Immigrants | Central America | 0.0 /100 | #304 | Tragic 16.8% |
| Immigrants | Grenada | 0.0 /100 | #305 | Tragic 16.8% |
| Immigrants | Caribbean | 0.0 /100 | #306 | Tragic 16.9% |
| Seminole | 0.0 /100 | #307 | Tragic 16.9% |