Nigerian vs Bahamian Female Poverty
COMPARE
Nigerian
Bahamian
Female Poverty
Female Poverty Comparison
Nigerians
Bahamians
14.8%
FEMALE POVERTY
1.7/ 100
METRIC RATING
231st/ 347
METRIC RANK
16.6%
FEMALE POVERTY
0.0/ 100
METRIC RATING
300th/ 347
METRIC RANK
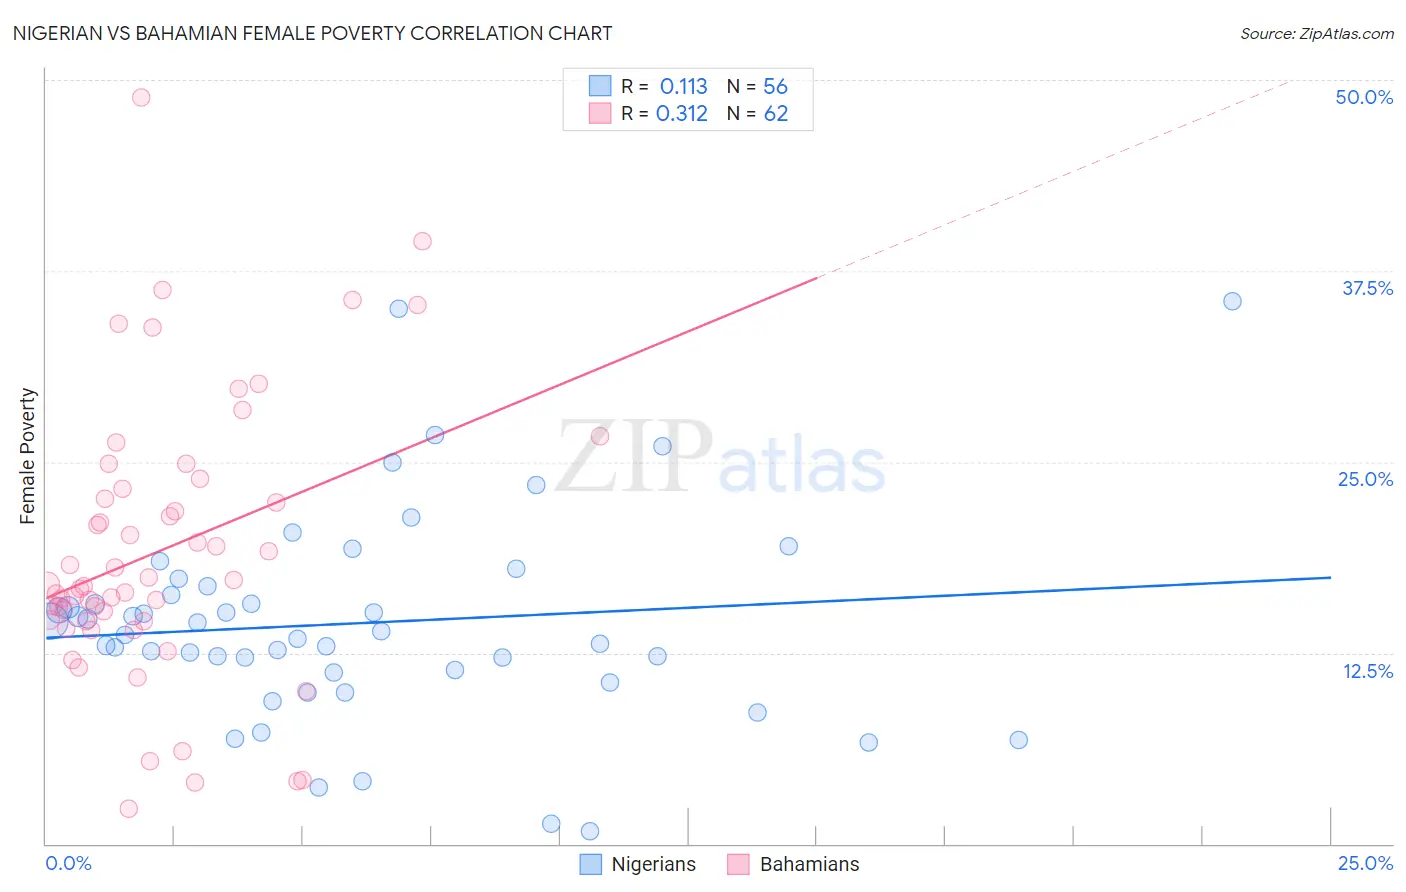
Nigerian vs Bahamian Female Poverty Correlation Chart
The statistical analysis conducted on geographies consisting of 332,444,319 people shows a poor positive correlation between the proportion of Nigerians and poverty level among females in the United States with a correlation coefficient (R) of 0.113 and weighted average of 14.8%. Similarly, the statistical analysis conducted on geographies consisting of 112,629,599 people shows a mild positive correlation between the proportion of Bahamians and poverty level among females in the United States with a correlation coefficient (R) of 0.312 and weighted average of 16.6%, a difference of 12.8%.
Female Poverty Correlation Summary
| Measurement | Nigerian | Bahamian |
| Minimum | 0.81% | 2.3% |
| Maximum | 35.6% | 48.8% |
| Range | 34.7% | 46.5% |
| Mean | 14.4% | 19.2% |
| Median | 13.8% | 16.9% |
| Interquartile 25% (IQ1) | 11.3% | 14.6% |
| Interquartile 75% (IQ3) | 16.6% | 23.2% |
| Interquartile Range (IQR) | 5.3% | 8.7% |
| Standard Deviation (Sample) | 6.8% | 9.1% |
| Standard Deviation (Population) | 6.7% | 9.0% |
Similar Demographics by Female Poverty
Demographics Similar to Nigerians by Female Poverty
In terms of female poverty, the demographic groups most similar to Nigerians are Alaska Native (14.7%, a difference of 0.10%), Ghanaian (14.7%, a difference of 0.30%), Osage (14.8%, a difference of 0.31%), German Russian (14.7%, a difference of 0.36%), and Immigrants from Saudi Arabia (14.8%, a difference of 0.41%).
| Demographics | Rating | Rank | Female Poverty |
| Americans | 2.8 /100 | #224 | Tragic 14.6% |
| Immigrants | Micronesia | 2.8 /100 | #225 | Tragic 14.6% |
| Immigrants | Eritrea | 2.4 /100 | #226 | Tragic 14.6% |
| Immigrants | Nigeria | 2.1 /100 | #227 | Tragic 14.7% |
| German Russians | 2.0 /100 | #228 | Tragic 14.7% |
| Ghanaians | 1.9 /100 | #229 | Tragic 14.7% |
| Alaska Natives | 1.8 /100 | #230 | Tragic 14.7% |
| Nigerians | 1.7 /100 | #231 | Tragic 14.8% |
| Osage | 1.5 /100 | #232 | Tragic 14.8% |
| Immigrants | Saudi Arabia | 1.4 /100 | #233 | Tragic 14.8% |
| Fijians | 1.1 /100 | #234 | Tragic 14.9% |
| Immigrants | Laos | 0.9 /100 | #235 | Tragic 15.0% |
| Cree | 0.7 /100 | #236 | Tragic 15.1% |
| French American Indians | 0.6 /100 | #237 | Tragic 15.1% |
| Immigrants | Armenia | 0.6 /100 | #238 | Tragic 15.1% |
Demographics Similar to Bahamians by Female Poverty
In terms of female poverty, the demographic groups most similar to Bahamians are Hispanic or Latino (16.6%, a difference of 0.040%), Guatemalan (16.7%, a difference of 0.33%), Chippewa (16.7%, a difference of 0.36%), Somali (16.6%, a difference of 0.56%), and Mexican (16.5%, a difference of 0.77%).
| Demographics | Rating | Rank | Female Poverty |
| Immigrants | Latin America | 0.0 /100 | #293 | Tragic 16.4% |
| Immigrants | Cabo Verde | 0.0 /100 | #294 | Tragic 16.4% |
| Senegalese | 0.0 /100 | #295 | Tragic 16.5% |
| Immigrants | Senegal | 0.0 /100 | #296 | Tragic 16.5% |
| Mexicans | 0.0 /100 | #297 | Tragic 16.5% |
| Somalis | 0.0 /100 | #298 | Tragic 16.6% |
| Hispanics or Latinos | 0.0 /100 | #299 | Tragic 16.6% |
| Bahamians | 0.0 /100 | #300 | Tragic 16.6% |
| Guatemalans | 0.0 /100 | #301 | Tragic 16.7% |
| Chippewa | 0.0 /100 | #302 | Tragic 16.7% |
| Choctaw | 0.0 /100 | #303 | Tragic 16.8% |
| Immigrants | Central America | 0.0 /100 | #304 | Tragic 16.8% |
| Immigrants | Grenada | 0.0 /100 | #305 | Tragic 16.8% |
| Immigrants | Caribbean | 0.0 /100 | #306 | Tragic 16.9% |
| Seminole | 0.0 /100 | #307 | Tragic 16.9% |